
Staples continue to serve as a haven

Key points:
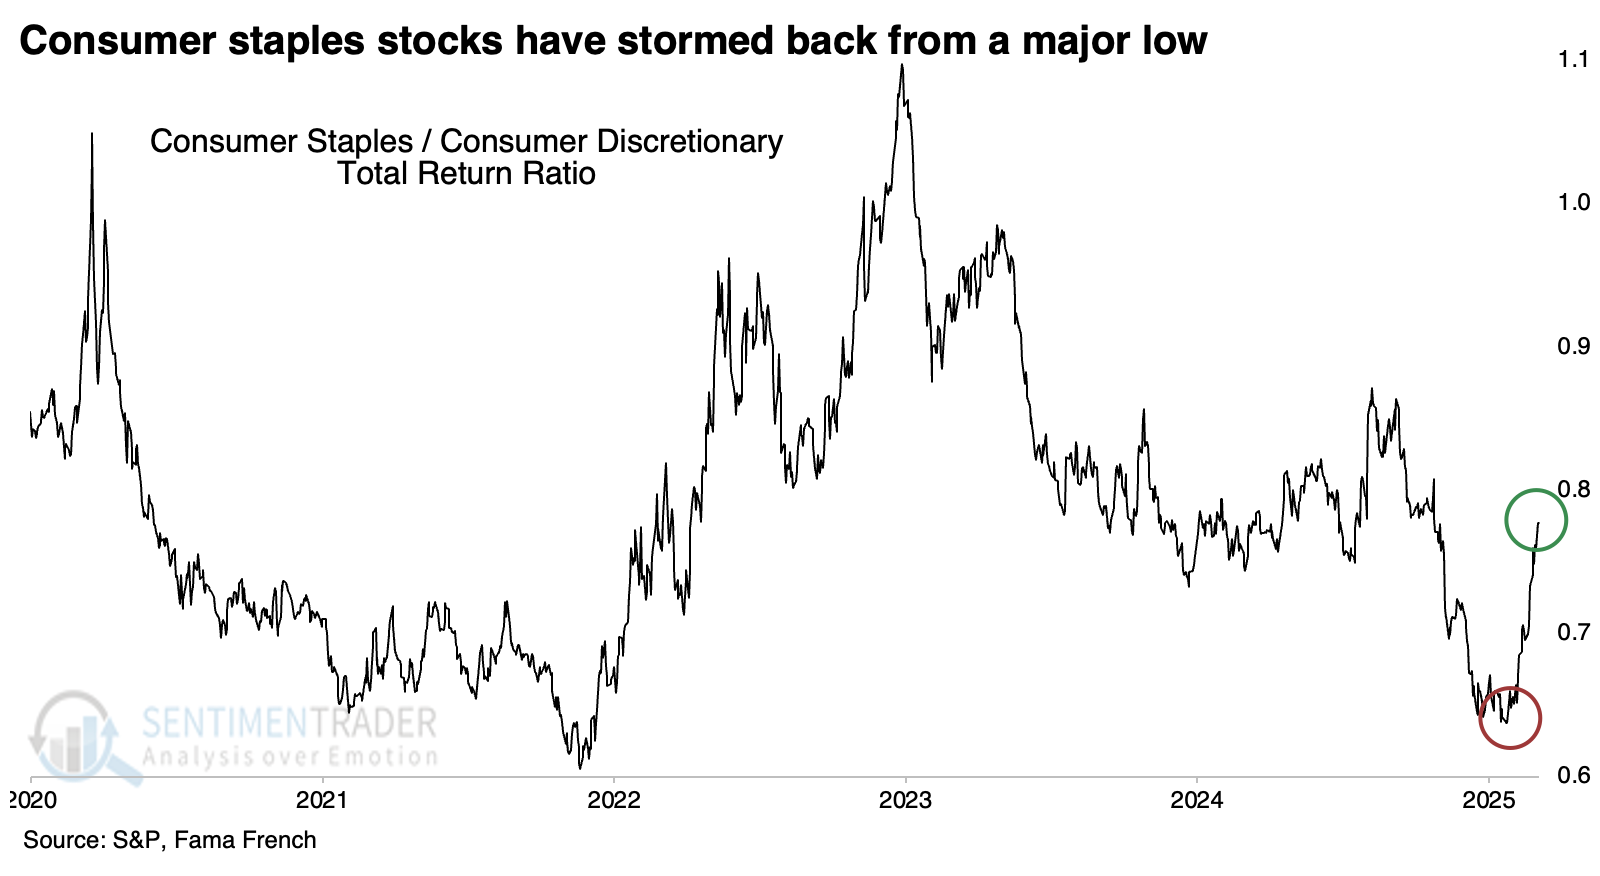
- Investors have pushed consumer staples stocks to a multi-month high relative to consumer discretionary
- This is a quick switch after the ratio between them had been at a multi-year low
- Similar cycles were not kind to the broad market, as investors tended to keep favoring defensive stocks
Staples continue to surge, relatively
There has been ample evidence of a shift in investors' preferences over weeks, even months. Gone are the days of bidding up future prospects; now, the emphasis is on solid sales of stuff people mostly need.
The shift has been dramatic enough to push the ratio of consumer staples stocks to consumer discretionary from a multi-year low to a multi-month high, continuing the rotation we witnessed at the end of January.
When we zoom out on the ratio, we can see that the low reached a couple of months ago was not just a multi-year low but nearly a 40-year low. This was occurring just as selling pressure in staples stocks was getting spiky.
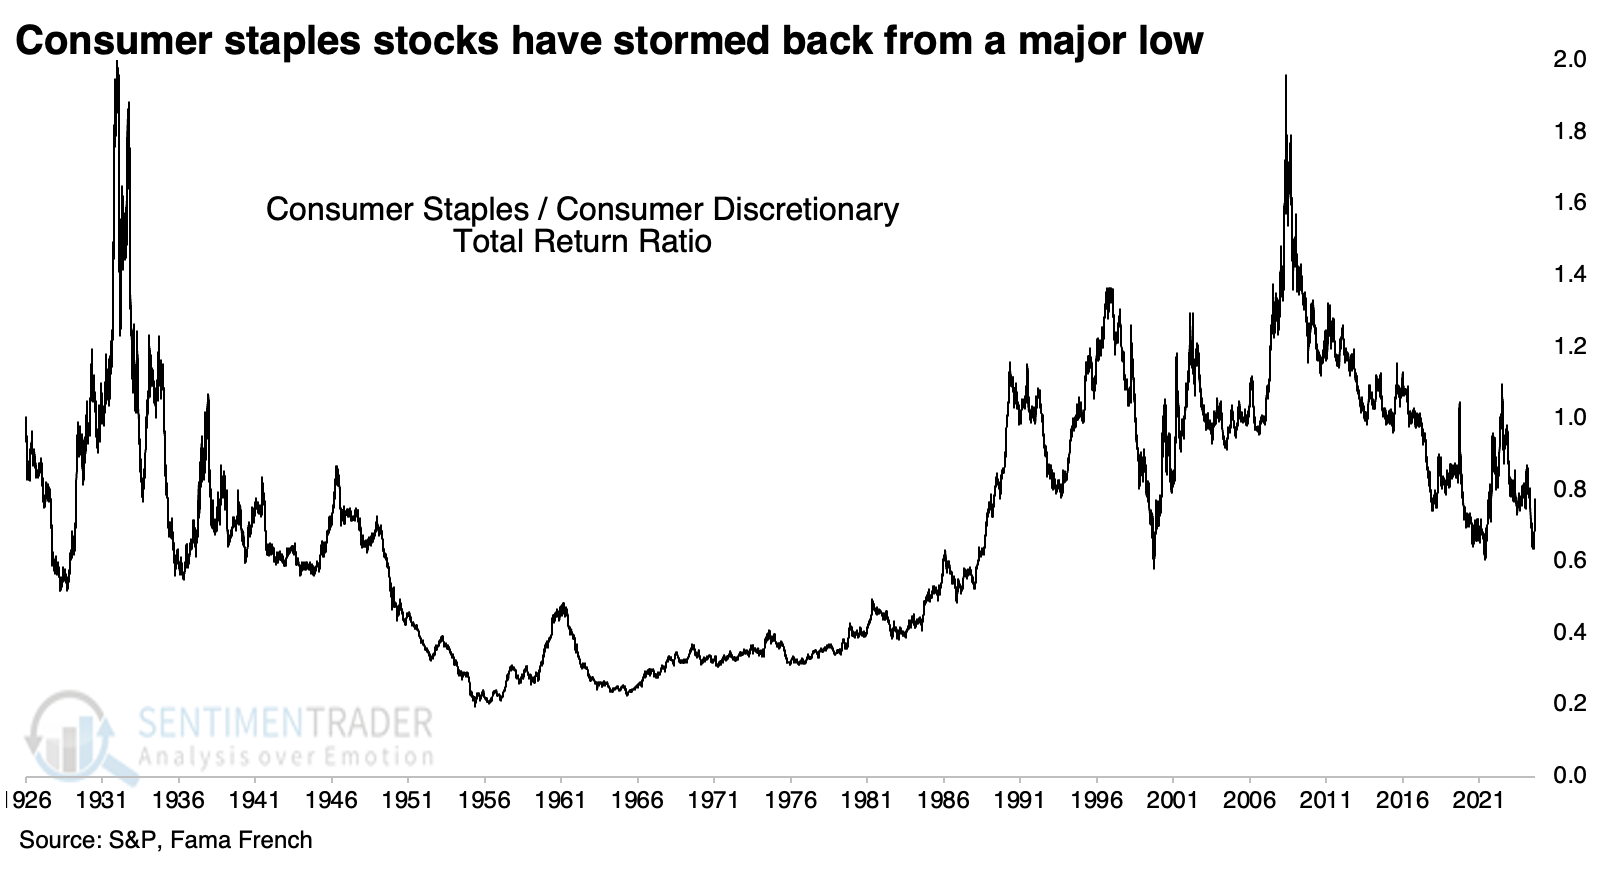
Market watchers like to use the ratio between staples and discretionary stocks as a risk-on/risk-off metric, which serves that purpose well. During bull markets, the ratio tends to trend lower, and during bear markets, it tends to rise. That makes the current spike in the ratio a bit troubling.
Probability of a protracted push
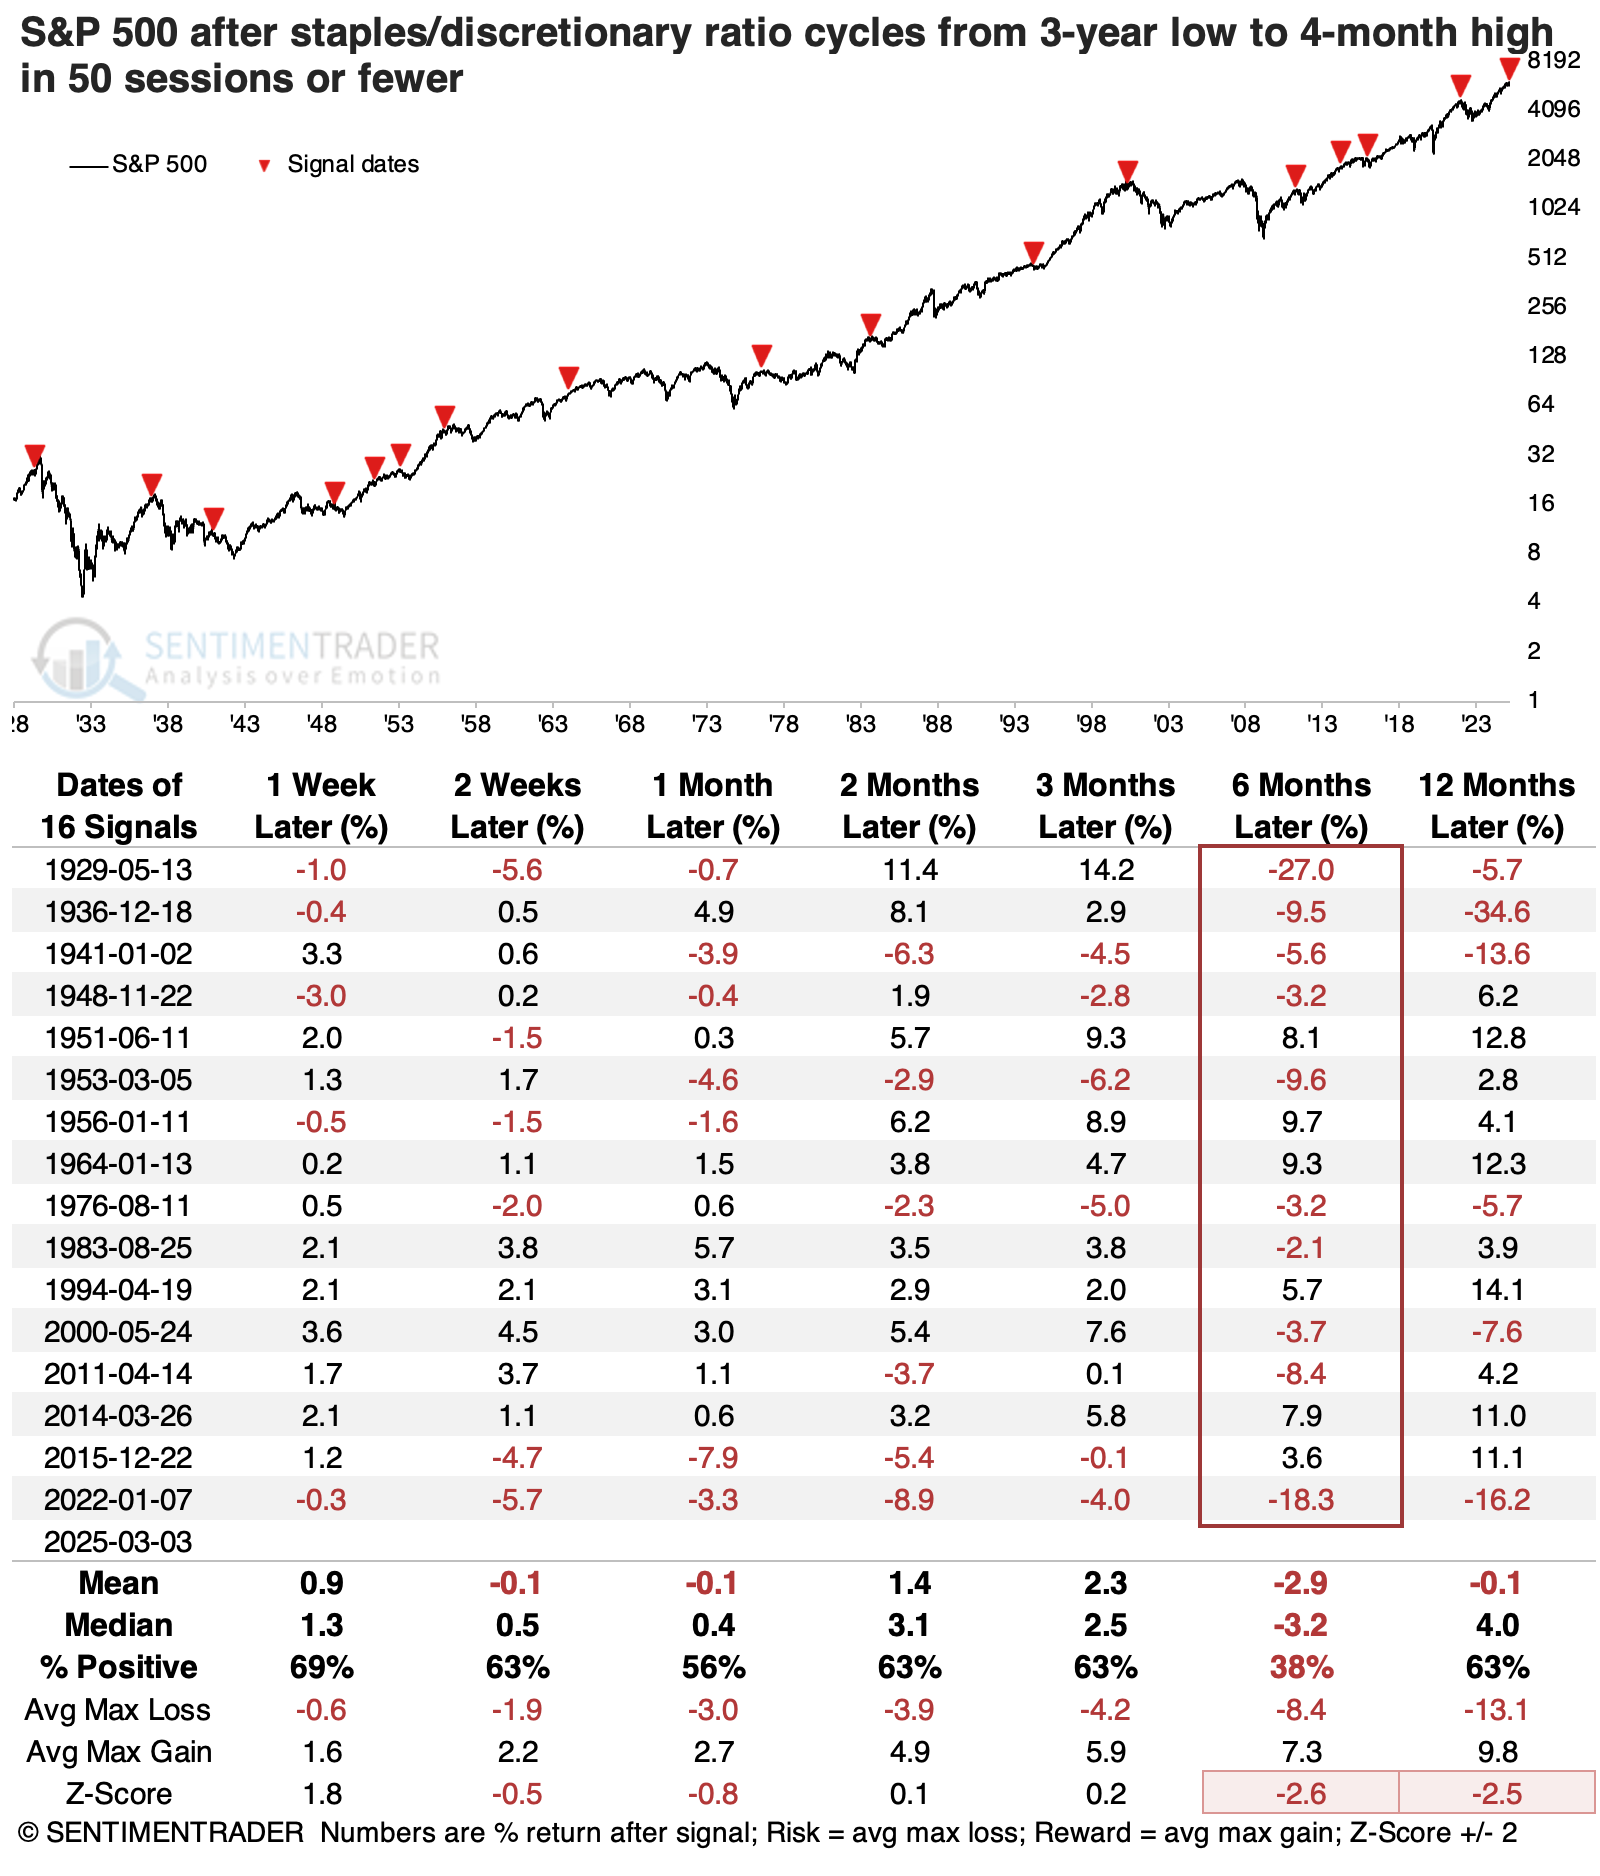
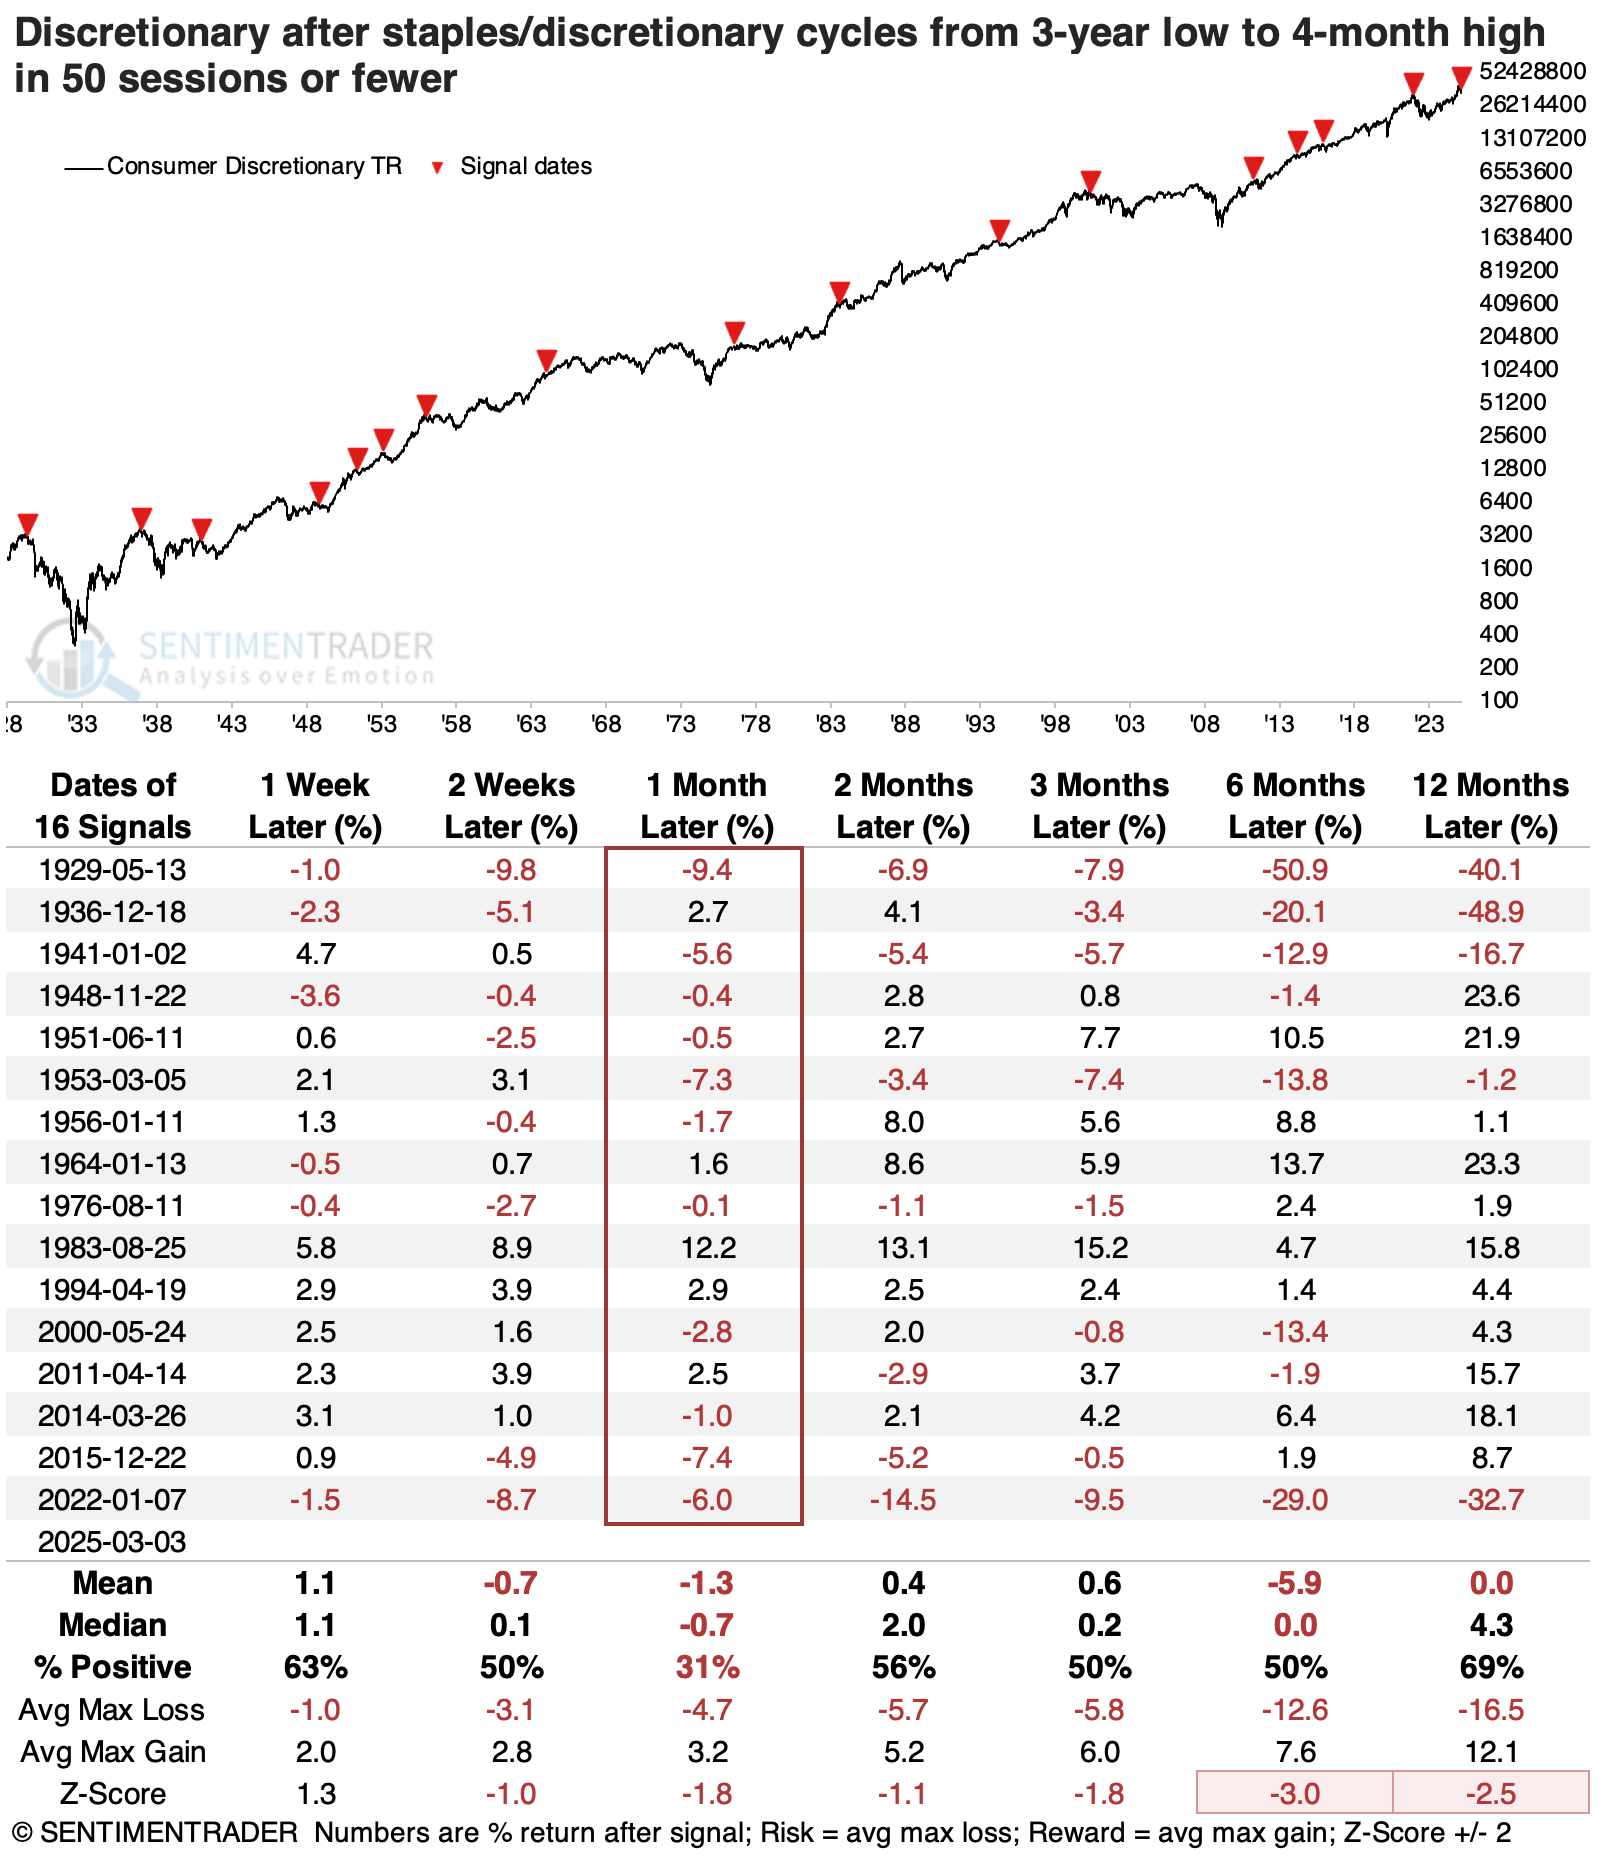
We can see below that when investors suddenly switched to a preference for staples over discretionary, the S&P 500 struggled over the following six months. Within that time frame, the S&P lost more than -10% six times while gaining more than +10% only three times.
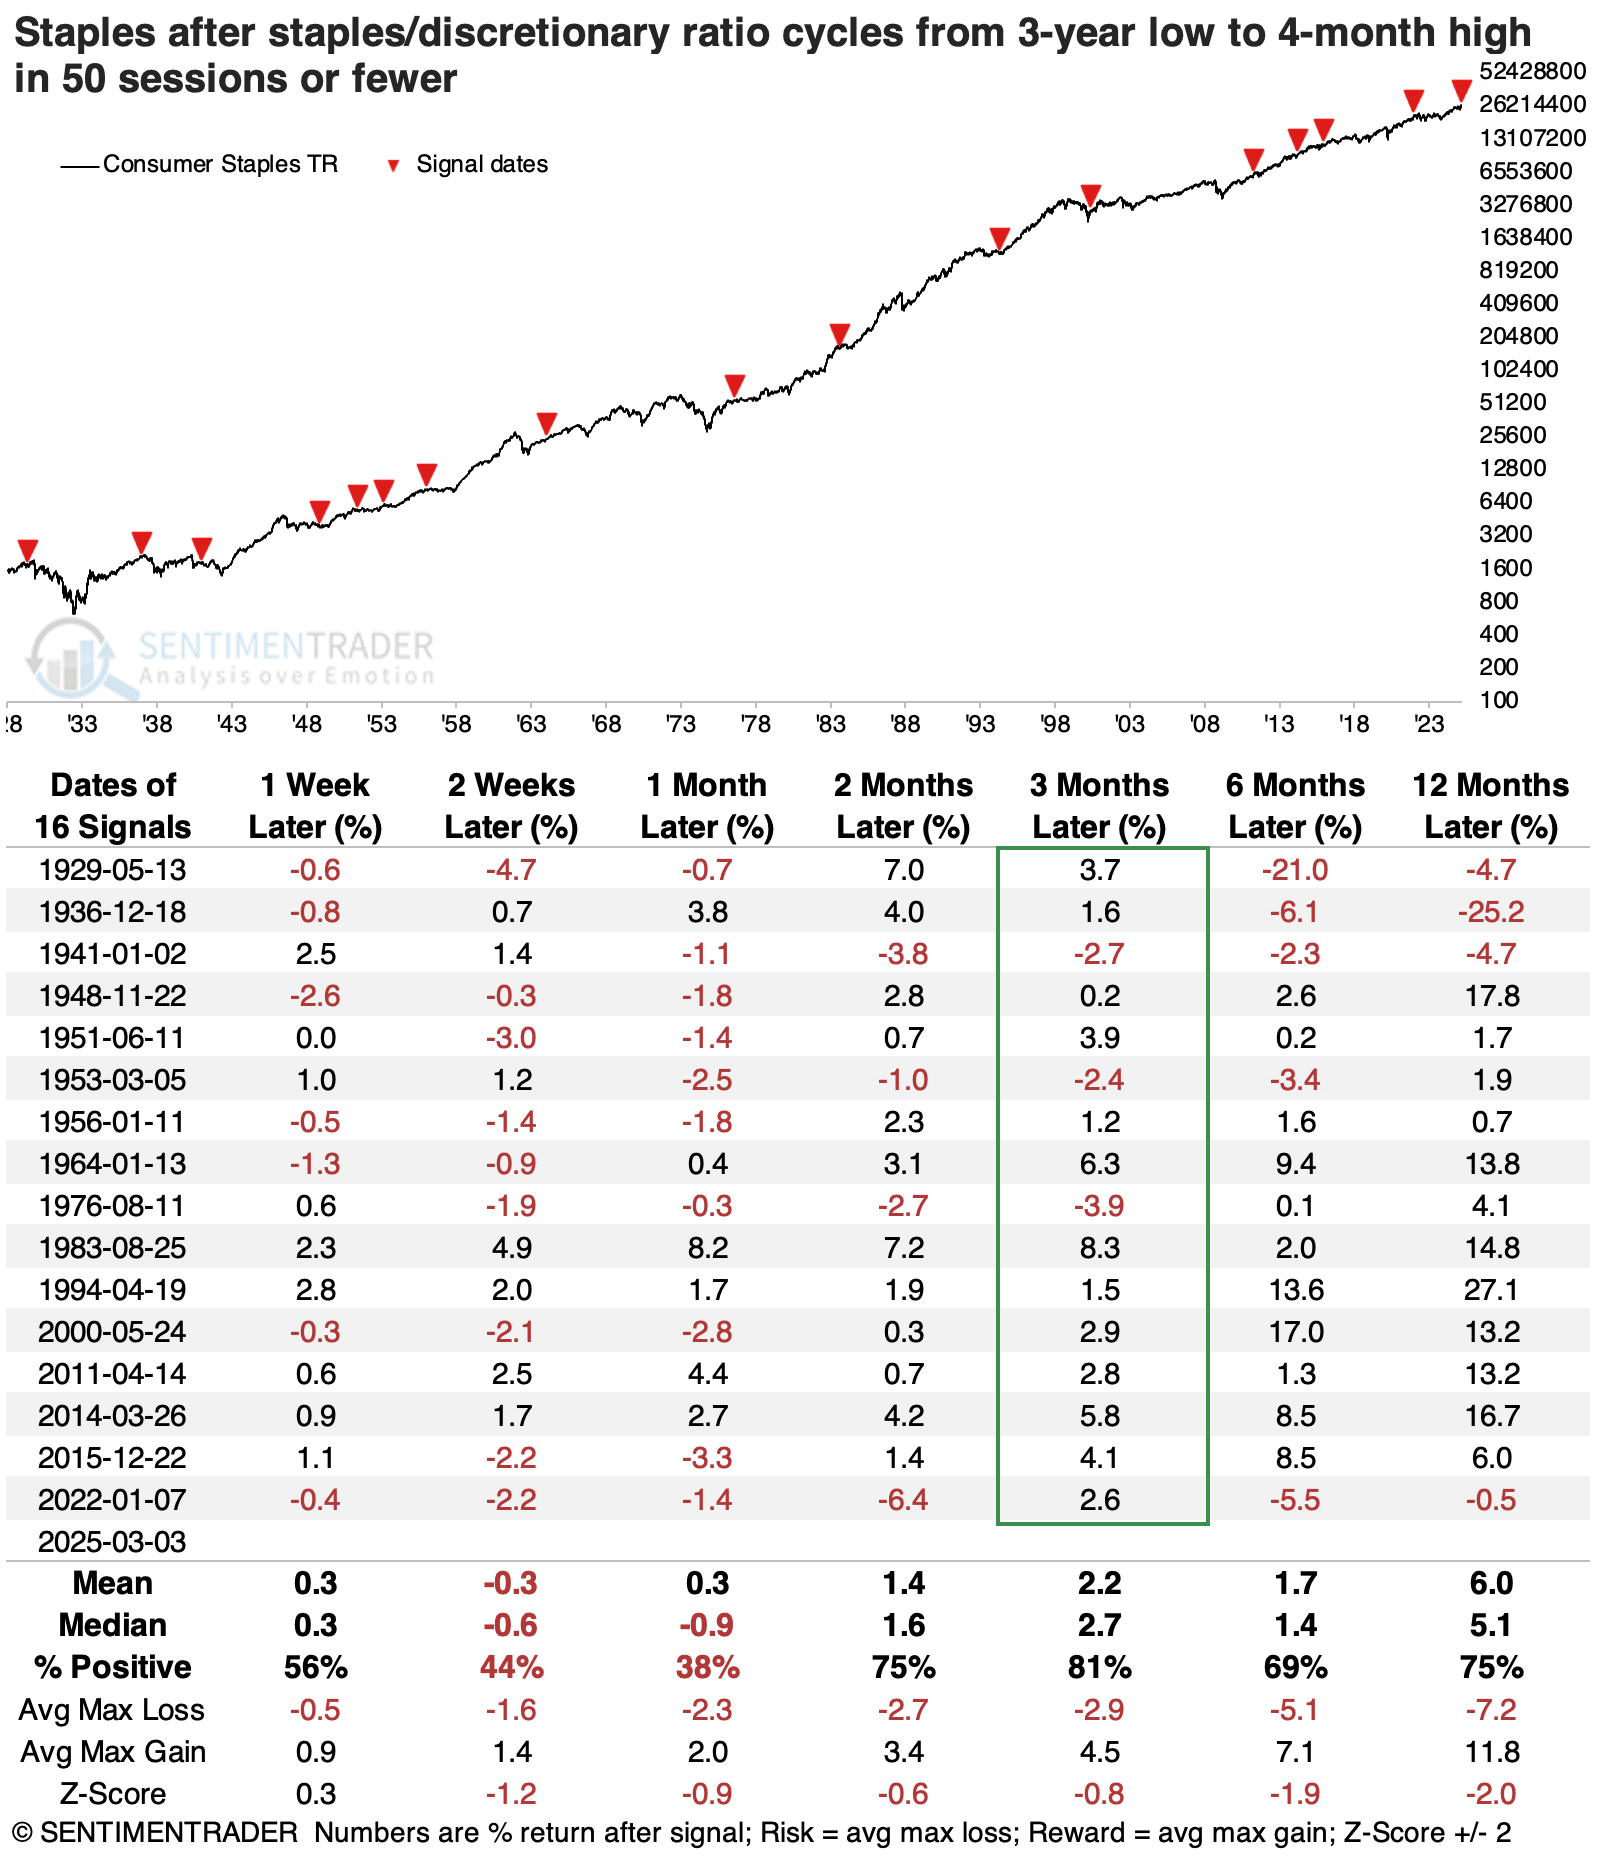
These were good signs for positive absolute returns for consumer staples over the next few months. While they often suffered some backing-and-filling during the next few weeks, those were almost all buying opportunities, with only three modest losses three months later.
Discretionary stocks had a tougher time. They suffered more over short time frames and, even six months later, showed a negative average return. More troubling, average risk was greater than average reward.
Another nod toward defense
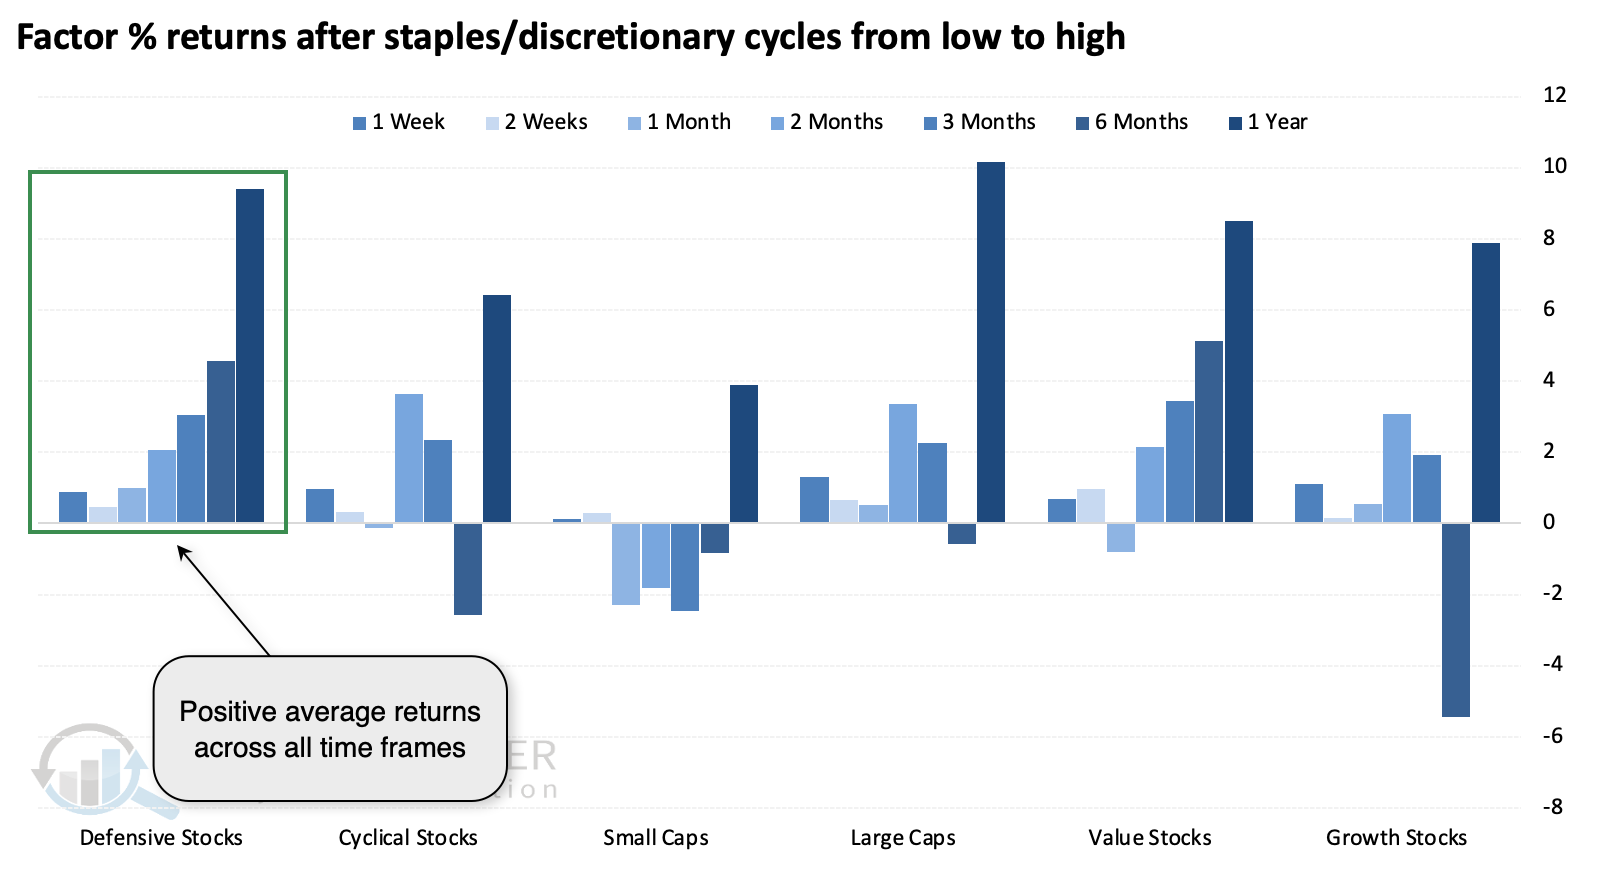
Defensive stocks, in general, fared the best after the ratio between staples and discretionary stocks cycled quickly, as it has over the past couple of months. They were the only factor to enjoy positive average returns across all time frames, with value stocks a close second.
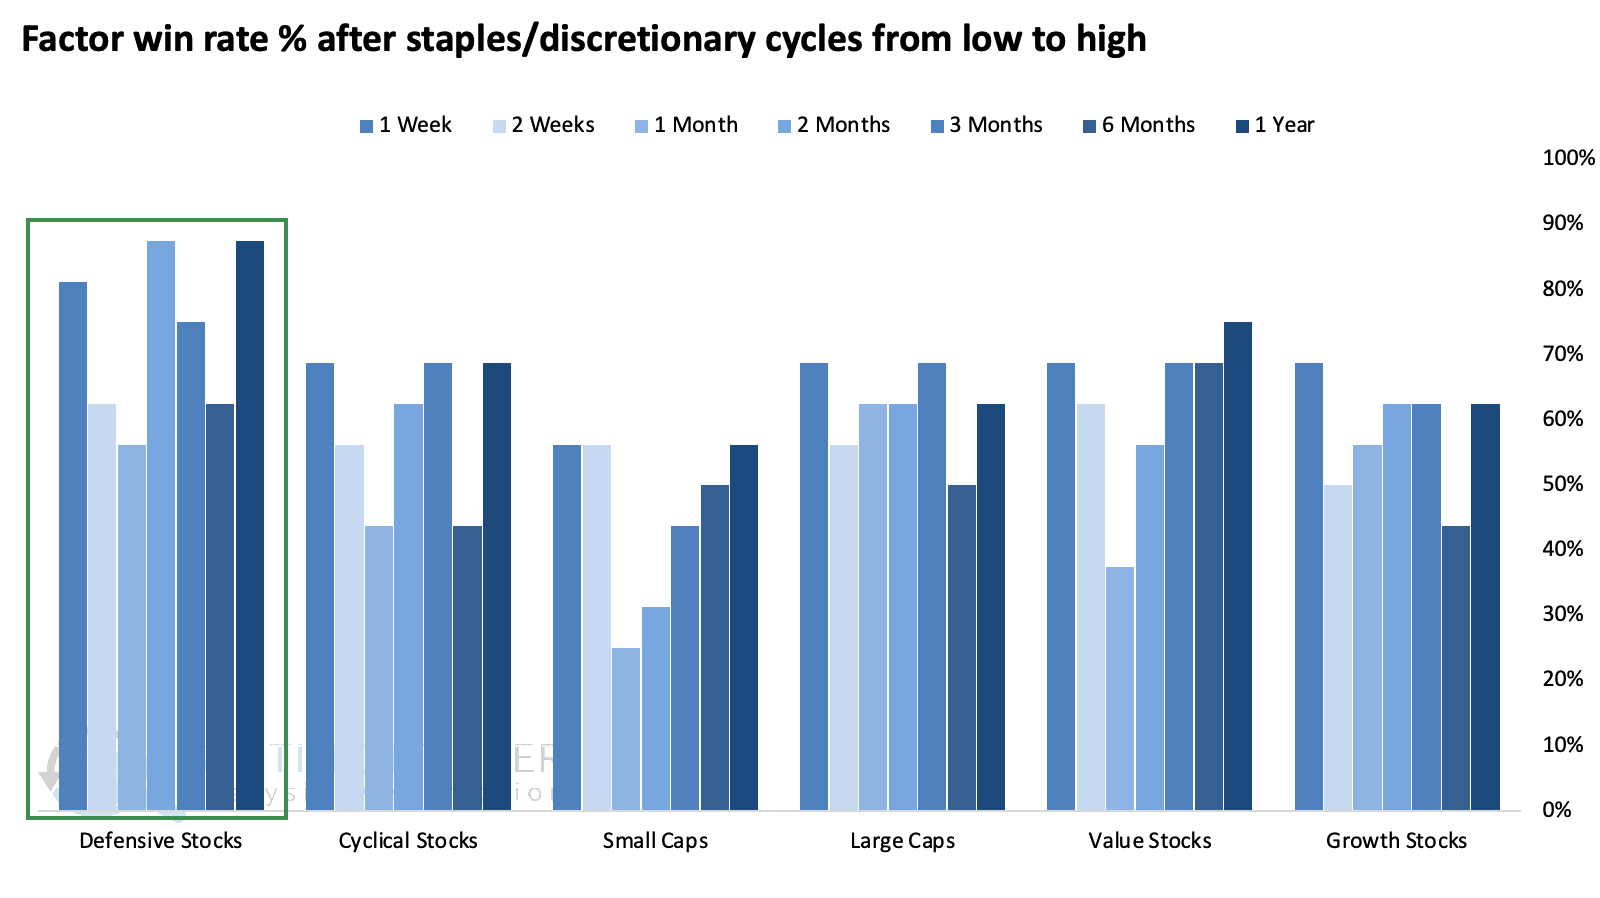
This is also reflected in the win rate, with defensive stocks being the most consistent winner, especially over longer time frames.
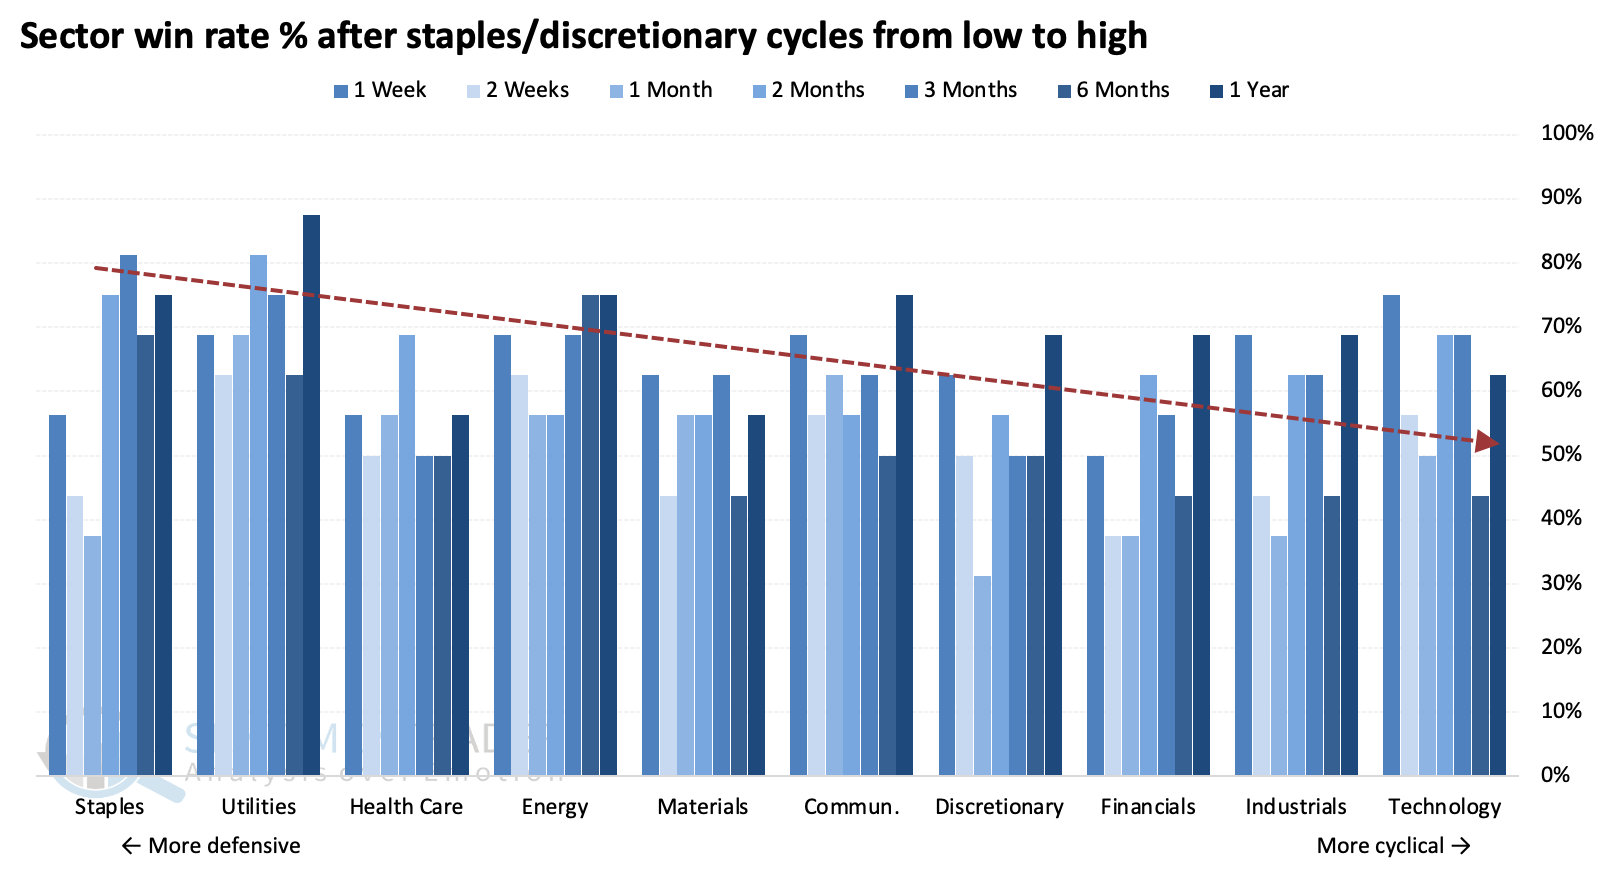
Among sectors, staples, utilities, and energy stood out as the safest havens, with consistently positive returns across time frames.
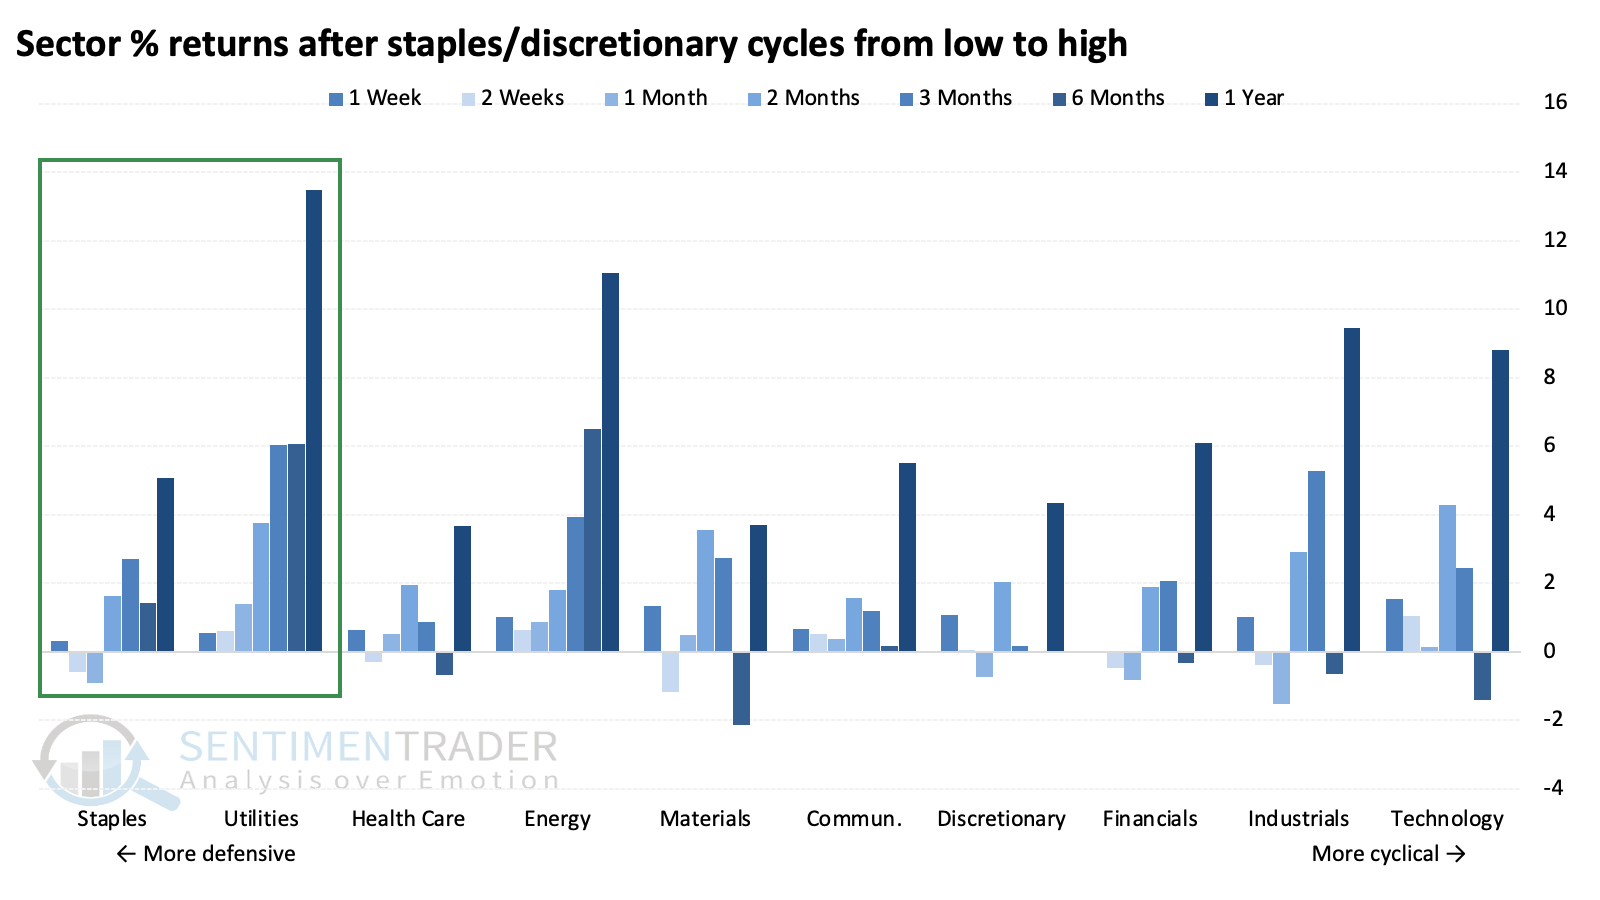
As we've seen in multiple other studies in recent weeks, the win rate across sectors shows a pretty clear pattern of decreasing the more cyclical the sector.
What the research tells us...
There have been warning signs for the broad U.S. stock market for weeks, even months. The average stock was not doing well, and sectors like staples had been hammered, which are often signs we see near a turn in popular indices like the capitalization-weighted S&P 500. That has happened once again, and signs still point to an extended trend in the current direction. That suggests continuing to favor more defensively positioned sectors like staples, utilities, and healthcare at the expense of more cyclically oriented ones like discretionary and technology stocks.