Products
SentimenTrader Trading Tools
‍
Backtest Engine
My Trading Toolkit
Correlation Analysis
Seasonality
Market Prediction
Indicators & Data API
‍
Proprietary Indicators & Charts
Market Data API
Strategies & Scanner
‍
50+ Trading Strategies
Smart Stock Scanner
Smart Option Scanner
Research Reports
‍
Research Solutions
Reports Library
Free Resources
Simple Backtest Calculator
Simple Seasonality Calculator
The Kelly Criterion Calculator
Sentiment Geo Map
Public Research Reports
Education
Sentiment Indicators
Technical Indicators
Pricing
Company
About
In the News
Testimonials
Client Success Stories
Contact
Log inLoginSign up
< BACK TO ALL REPORTS

SPX up 15 of 17 weeks (does it matter?)

Jay Kaeppel
2024-02-28
The S&P 500 recently registered its 15th up week in the last 17 weeks. This is being touted by some on social media as a "bullish confirmation," while others suggest an overbought situation due for a "pause." We decided to test the data and see what it really means.

Key points

  • The S&P 500 closed higher in 15 of the last 17 weeks
  • This fact is being heavily touted on social media
  • But the relevant question is, "Does it matter?"

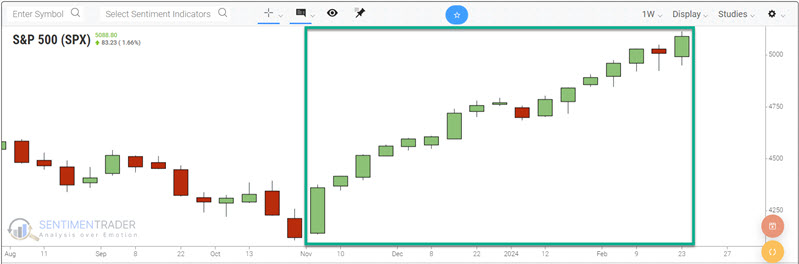
The S&P 500 has enjoyed a terrific run

As of the week ending 2024-02-23, the S&P 500 closed higher in 15 of the last 17 weeks, as shown in the chart below.

This is an infrequent occasion - as seen in the chart below. This has not happened since 1989.

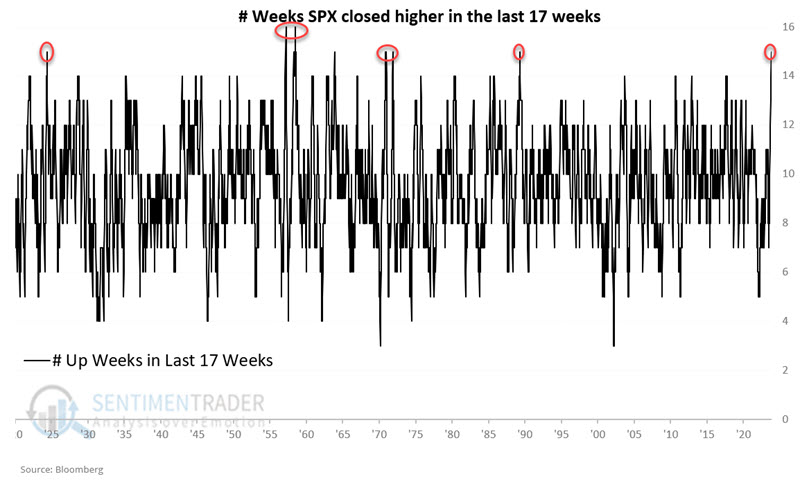
The chart above (or similar) has been touted widely on social media this week. Interestingly, some claim it is bullish, and others claim it is not. While this is an interesting development and seems significant, the real question is, "Does it matter?"

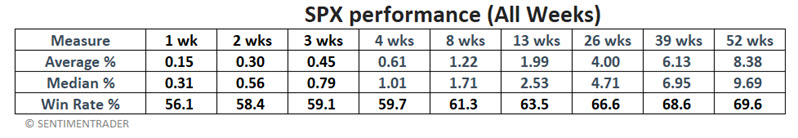
Setting the baseline

The table below summarizes S&P 500 performance for 1, 2, 3, 4, 8, 13, 26, 39, and 52 weeks considering all weeks starting on 1920-04-30. 

Looking only at "15 of 17 Up Weeks"

Let's look only at weeks that met the "15 of 17 Up Weeks" criteria. The table below displays all dates and S&P 500 performance when these criteria were met.

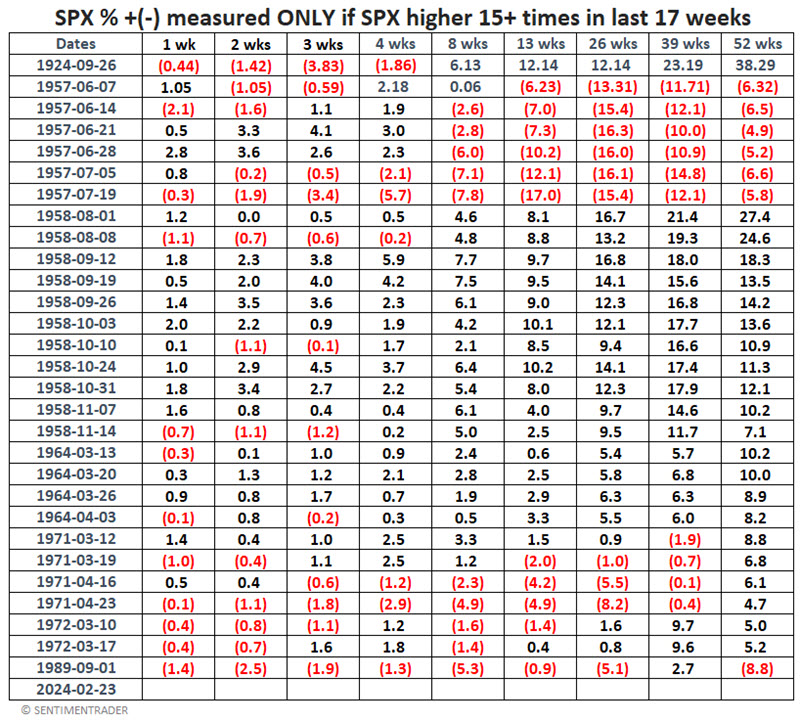
The table below summarizes S&P 500 performance following "15 of 17 up weeks" AND how these results compare to All Weeks.

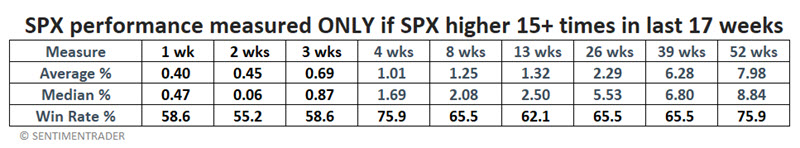
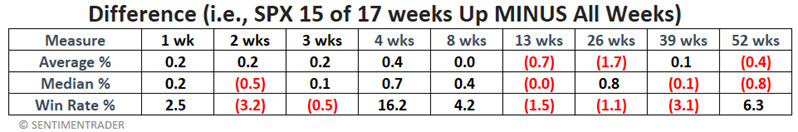
The bottom line is "mixed results." Some periods have shown better performance and higher Win Rates than All Weeks; others have shown worse. The bottom line is that anyone touting the latest 15 of 17 Up Weeks occurrence on 2024-02-23 as a decidedly "bullish" or "bearish" omen has probably not seen this data.

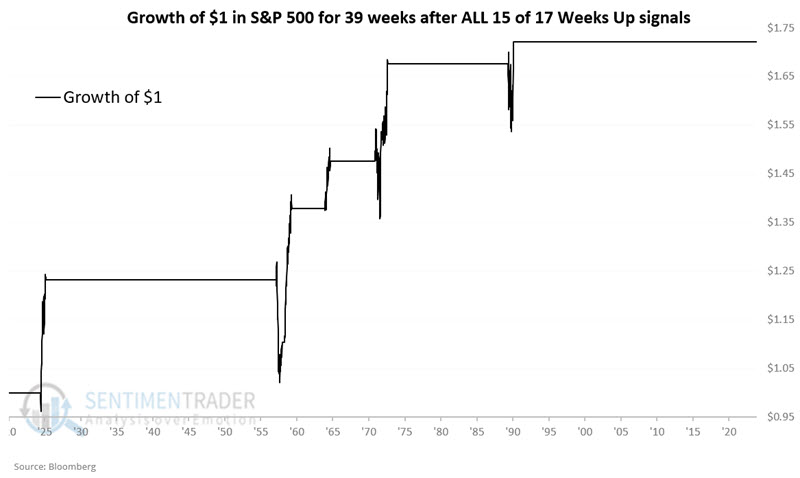
Using the "15 of 17 UP Weeks" anomaly systematically

Before writing off 15 of 17 Weeks as "not terribly significant," let's take one more pass at using this event. The method below uses the following "Rules":

  • If SPX has closed higher for at least 15 of the last 17 weeks, buy and hold the S&P 500 Index for 39 weeks
  • If during this initial 39 weeks, another "15 of 17 Up Week" occurs, extend the holding period for another 39 week

The equity curve displays the growth of $1 invested using this approach.

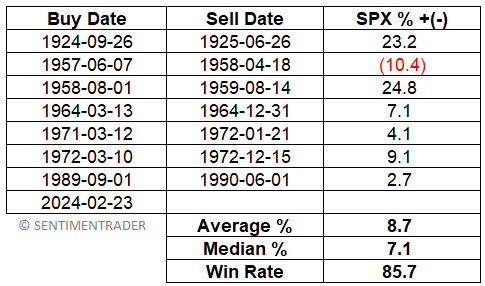
The table below shows the "trades" and summarizes the results of systematically using the rules above.

What the research tells us…

Is there value in noting when the S&P 500 closes higher for at least 15 of 17 weeks? That is for each individual to decide for themselves. We can state with some certainty that not every market anomaly posted on social media "means what someone says it means."

PRODUCTS
SentimenTrader
Trading Tools
Indicators & Data API
‍
Strategies & Scanner
‍
Research Reports
FREE
RESOUrCES
Simple Backtest
Calculator
Simple Seasonality
Calculator
The Kelly Criterion
Calculator
Sentiment Geo Map
‍
Public Research Reports
‍
Education
Sentiment Indicators
‍
Technical Indicators
‍
Pricing
Bundle pricing
‍
FAQ
‍
Announcements
‍
COMPANY
‍
About
‍
In the News
‍
Testimonials
‍
Client Success Stories
CONTACT
‍
General Inquiries
‍
Media Inquiries
‍
Financial Professionals Inquiries
‍
© 2026 Sundial Capital Research Inc. All rights reserved.
Setsail Marketing
TermsPrivacyAffiliate Program
Risk Disclosure: The information and tools provided are for research and analytical purposes only and are not intended as investment advice. Market analysis involves uncertainty, and outcomes may differ from expectations. Users should conduct their own due diligence and consider their individual circumstances before making any financial decisions. Past performance is not necessarily indicative of future results.

Hypothetical Performance Disclosure: Hypothetical performance results have many inherent limitations, some of which are described below. No representation is being made that any account will or is likely to achieve profits or losses similar to those shown; in fact, there are frequently sharp differences between hypothetical performance results and the actual results subsequently achieved by any particular trading program. One of the limitations of hypothetical performance results is that they are generally prepared with the benefit of hindsight. In addition, hypothetical trading does not involve financial risk, and no hypothetical trading record can completely account for the impact of financial risk of actual trading. for example, the ability to withstand losses or to adhere to a particular trading program in spite of trading losses are material points which can also adversely affect actual trading results. There are numerous other factors related to the markets in general or to the implementation of any specific trading program which cannot be fully accounted for in the preparation of hypothetical performance results and all which can adversely affect trading results.

Testimonial Disclosure: Testimonials appearing on this website may not be representative of other clients or customers and is not a guarantee of future performance or success.