Products
SentimenTrader Trading Tools
‍
Backtest Engine
My Trading Toolkit
Correlation Analysis
Seasonality
Market Prediction
Indicators & Data API
‍
Proprietary Indicators & Charts
Market Data API
Strategies & Scanner
‍
50+ Trading Strategies
Smart Stock Scanner
Smart Option Scanner
Research Reports
‍
Research Solutions
Reports Library
Free Resources
Simple Backtest Calculator
Simple Seasonality Calculator
The Kelly Criterion Calculator
Sentiment Geo Map
Public Research Reports
Education
Sentiment Indicators
Technical Indicators
Pricing
Company
About
In the News
Testimonials
Client Success Stories
Contact
Log inLoginSign up
< BACK TO ALL REPORTS

SPX RSI Reversal as a Momentum Signal

Jay Kaeppel
2026-04-21
The weekly RSI indicator for the S&P 500 Index recently completed a swing from high to low. Historically, the market has shown a strong tendency to follow through to the upside. We detail the signal - and the history - herein.

Key points:

  • Momentum is an important factor in the stock market, particularly when it follows an oversold condition
  • The S&P 500 weekly RSI dropped below 40 during the March 2026 sell-off
  • On April 17th, the weekly RSI closed back above 60, thus triggering a historically compelling momentum signal

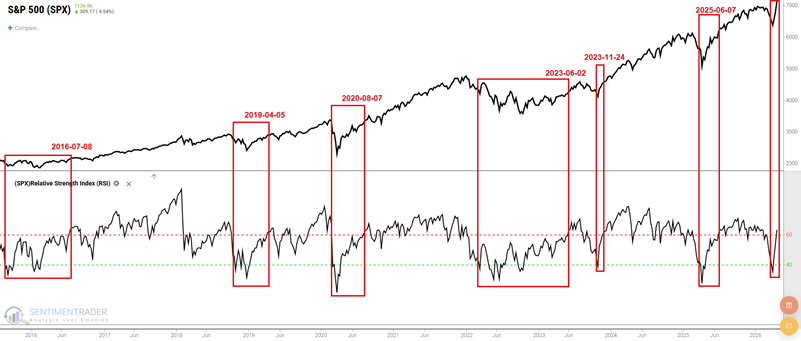
A reversal for Weekly RSI

The standard Relative Strength Index (RSI) indicator measures to what degree an asset is overbought, oversold, or somewhere in between. One useful study looks for an oversold signal to occur, and then monitors for a powerful reversal as a sign of potentially better days ahead.

What we will test for specifically is the following pattern using the 14-week Relative Strength Index (RSI) for the S&P 500 index:

  • The 14-week S&P 500 RSI closes a week below 40
  • Subsequently, the same 14-week RSI closed a week back above 60
  • Once this pattern completes, we will deem the market environment as favorable for stocks for at least 189 trading days

The chart below shows the entry and exit dates using the rules above since 1970. Most recently, the 14-week S&P 500 RSI closed below 40 during the week of March 27th. Just three weeks later, the RSI closed above 60 on April 17th. 

The chart below highlights the last 10 years of signal activity. The red boxes in the chart below highlight the pe

Sorry, you don't have access to this report

Upgrade your subscription plan to get access
Go to Dasboard
PRODUCTS
SentimenTrader
Trading Tools
Indicators & Data API
‍
Strategies & Scanner
‍
Research Reports
FREE
RESOUrCES
Simple Backtest
Calculator
Simple Seasonality
Calculator
The Kelly Criterion
Calculator
Sentiment Geo Map
‍
Public Research Reports
‍
Education
Sentiment Indicators
‍
Technical Indicators
‍
Pricing
Bundle pricing
‍
FAQ
‍
Announcements
‍
COMPANY
‍
About
‍
In the News
‍
Testimonials
‍
Client Success Stories
CONTACT
‍
General Inquiries
‍
Media Inquiries
‍
Financial Professionals Inquiries
‍
© 2026 Sundial Capital Research Inc. All rights reserved.
Setsail Marketing
TermsPrivacyAffiliate Program
Risk Disclosure: The information and tools provided are for research and analytical purposes only and are not intended as investment advice. Market analysis involves uncertainty, and outcomes may differ from expectations. Users should conduct their own due diligence and consider their individual circumstances before making any financial decisions. Past performance is not necessarily indicative of future results.

Hypothetical Performance Disclosure: Hypothetical performance results have many inherent limitations, some of which are described below. No representation is being made that any account will or is likely to achieve profits or losses similar to those shown; in fact, there are frequently sharp differences between hypothetical performance results and the actual results subsequently achieved by any particular trading program. One of the limitations of hypothetical performance results is that they are generally prepared with the benefit of hindsight. In addition, hypothetical trading does not involve financial risk, and no hypothetical trading record can completely account for the impact of financial risk of actual trading. for example, the ability to withstand losses or to adhere to a particular trading program in spite of trading losses are material points which can also adversely affect actual trading results. There are numerous other factors related to the markets in general or to the implementation of any specific trading program which cannot be fully accounted for in the preparation of hypothetical performance results and all which can adversely affect trading results.

Testimonial Disclosure: Testimonials appearing on this website may not be representative of other clients or customers and is not a guarantee of future performance or success.