
SPX during August and September of midterm years

Key Points
- The months of August and September have individually registered lackluster results during mid-term years
- Combined, the months of August and September have shown a net loss during mid-term years over the past 100 years
- On an election-cycle by election-cycle basis, results can vary widely
August and September of mid-term election years
The chart below displays the cumulative % return for the S&P 500 Index if held only during August (black line) and September (red line) during every mid-term election year since 1920.
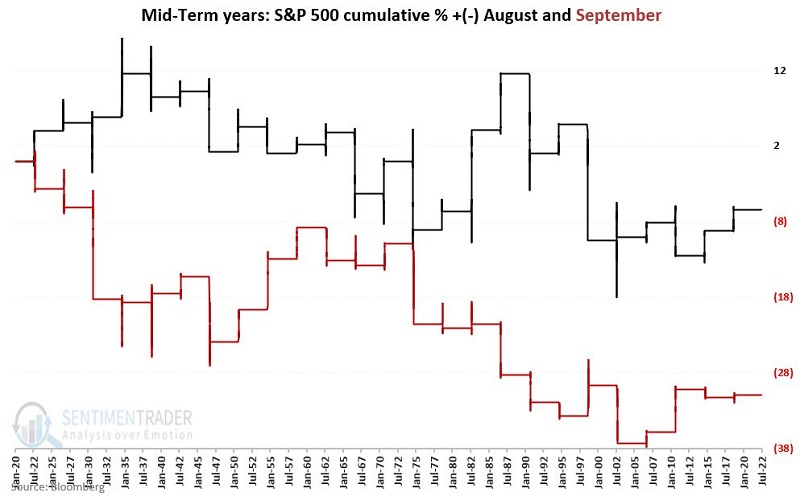
The results are pretty random on an election cycle to election cycle basis, with both months showing some gains and some losses. The critical thing to note is that both months have registered a net loss over the past 100 years.
August and September combined
The chart below displays the cumulative % price performance for the S&P 500 Index if held only during August AND September of each mid-term election year starting in 1922.
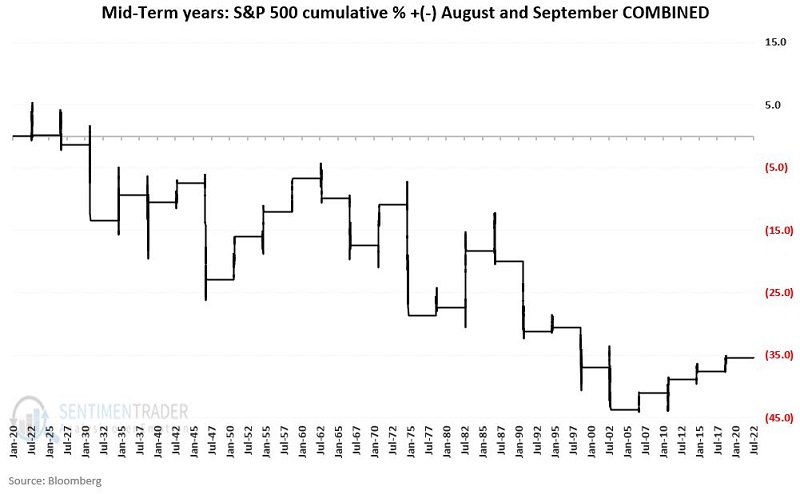
The cumulative return has been -35.4%. Not exactly thrilling. At the same time, it might not be entirely accurate to categorize the results as "bearish." Let's start with the "good news." Overall, this two-month period showed a gain 56% of the time and a loss only 44% of the time. Also, each of the last four mid-term election years has seen August/September register a net gain. The bad news is that when this period is bad, it tends to be very bad.
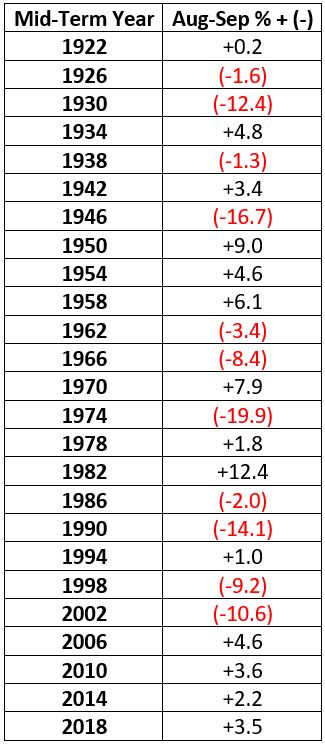
The table below displays the net August/September % +(-) during each midterm election year since 1922.
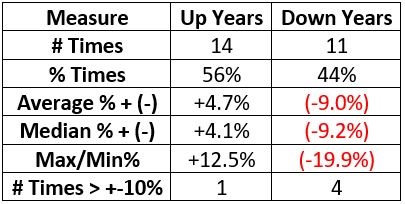
The table below displays a summary of August/September mid-term year results.
Adding a simple price filter
It is rarely a good idea to trade based solely on seasonality as a standalone indicator. So, let's add the most important indicator of all - price action. Let's add a 200-day exponential moving average to help designate the current price trend for $SPX as "bullish" or "bearish." The chart below (courtesy of StockCharts) displays the ticker $SPX versus its 200-day EMA. As you can see, the price is presently well below the 200-day EMA.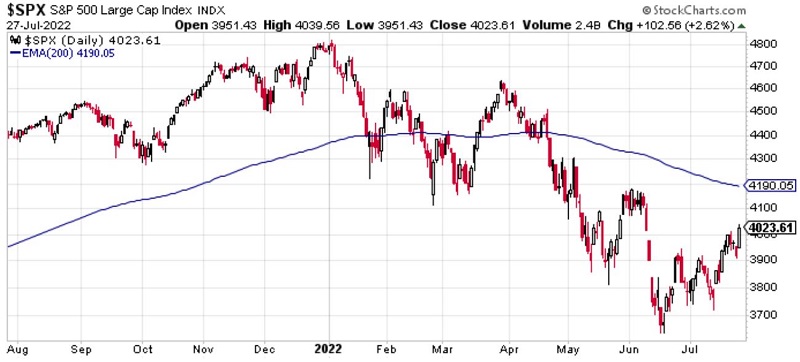
Let's focus solely on August and September of mid-term election years.
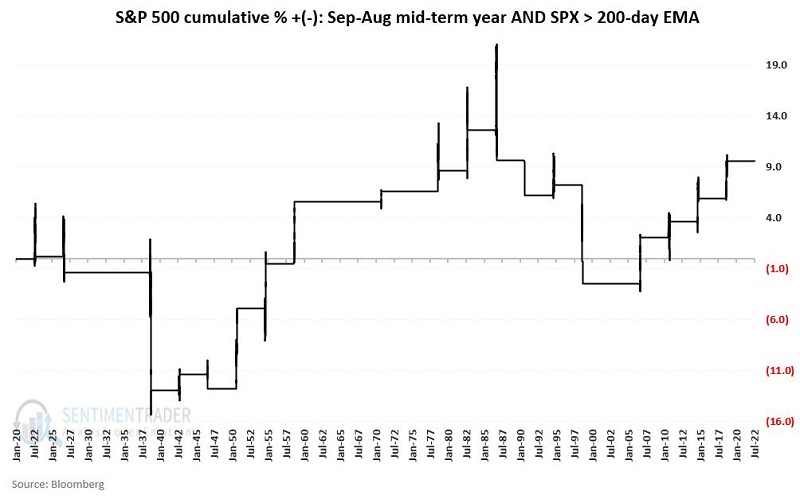
The chart below displays the cumulative % gain/loss for $SPX when:
- The month is August or September of a mid-term election year
- AND $SPX is ABOVE its 200-day EMA
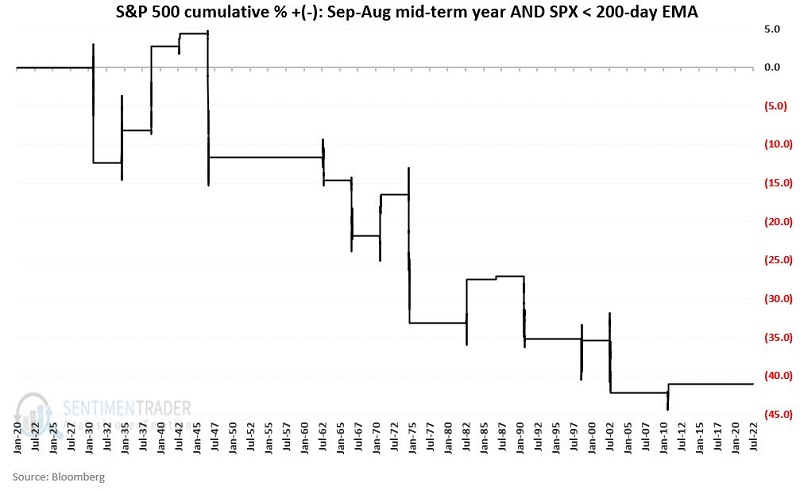
The chart below displays the cumulative % gain/loss for $SPX when:
- The month is August or September of a mid-term election year
- AND $SPX is BELOW its 200-day EMA
During this unfavorable seasonal period:
- Cumulative gain when $SPX > 200-day EMA = +10%
- Cumulative loss when $SPX < 200-day EMA = (-41%)
What the research tells us…
As stated above, it is probably a mistake to categorize this impending two-month period as seasonally "bearish." Still, the historical results argue for caution during the next two months. Perhaps the fact that the last four mid-term August/September periods have shown a gain means this study no longer holds any meaning. Or, maybe this period is due for a "reversion to the mean" with another down period.
And therein lies the risk. With an average two-month loss of -9.2% - and with the S&P 500 Index below its 200-day EMA - the risk of a fast and substantial decline in the months ahead remains a possibility that investors should make plans to avoid.