Products
SentimenTrader Trading Tools
‍
Backtest Engine
My Trading Toolkit
Correlation Analysis
Seasonality
Market Prediction
Indicators & Data API
‍
Proprietary Indicators & Charts
Market Data API
Strategies & Scanner
‍
50+ Trading Strategies
Smart Stock Scanner
Smart Option Scanner
Research Reports
‍
Research Solutions
Reports Library
Free Resources
Simple Backtest Calculator
Simple Seasonality Calculator
The Kelly Criterion Calculator
Sentiment Geo Map
Public Research Reports
Education
Sentiment Indicators
Technical Indicators
Pricing
Company
About
In the News
Testimonials
Client Success Stories
Contact
Log inLoginSign up
< BACK TO ALL REPORTS

Speculative volume explodes...and the smart money is selling

Jason Goepfert
2021-02-11
Volume in penny stocks has continued to explode higher as "smart money" investors apparently sell during the last hour of trading.

Last month, there was a remarkable jump in the most speculative corners of the market, including leveraged vehicles like options and margin trading, and lottery ticket shares in the form of penny stocks.

The roaming horde of speculators found that niche in December, with more than 1 trillion shares traded. It picked up even more in January and has rocketed even higher so far in February.

At the same time, all this speculative volume is coming in, the "smart money" seems to be selling. That's based on the admittedly tenuous idea that sophisticated investors wait until the near close of the day to trade. And lately, the last hour has been consistently negative.

Below is a cumulative advance/decline line of last-hour activity that we update daily. If the S&P 500 rises during the last hour, then this indicator adds 1 to its running total; if the S&P sees selling to end the day, then the indicator subtracts 1. We've seen so much last-hour selling lately that this has been hovering near its lowest level since 2016. 

Last hour indicator

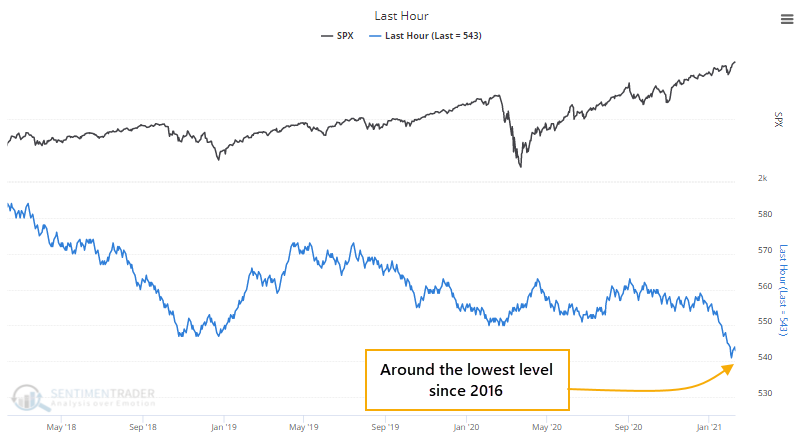
Going back more than 25 years, we've never seen so many days with this measure near its lows while the S&P is near its highs.


What else we're looking at

  • A deeper look at recent trends in speculative volume
  • Charts showing times when stocks were near highs and "smart money" selling was at the opposite extreme
  • A risk-off model showing the spread between shorter-term highs and lows
  • The 20-year pattern in stocks tells a compelling story

Stat Box

On Wednesday, the Russell 2000 fund, IWM, gapped up after having already rallied for 7 consecutive days. In its 20+ year history, it had managed this only 6 other times, all of which marked short-term buying exhaustion...for what that's worth in this market.


Sentiment from other perspectives

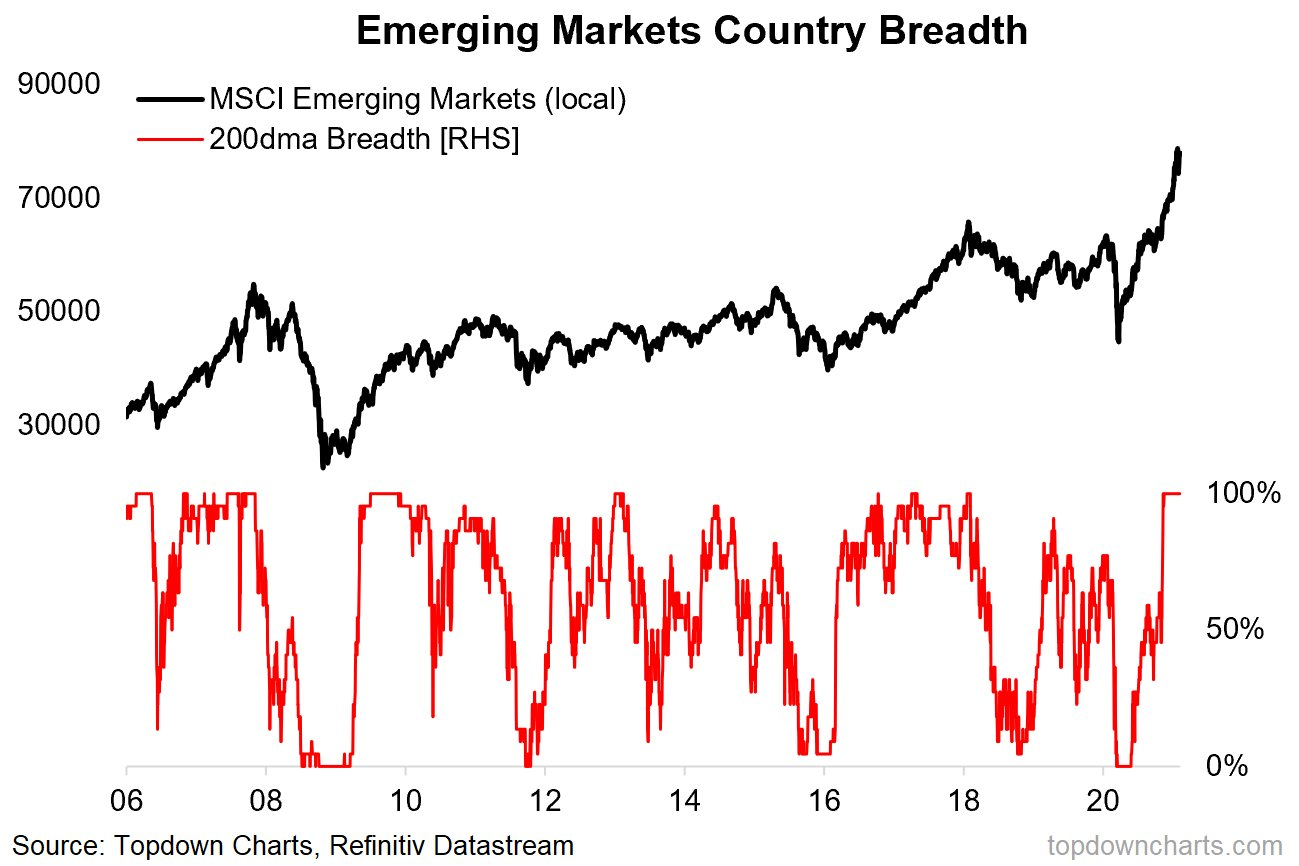
Everything is rallying. Among emerging markets, 100% of them are trading above their 200-day moving averages. Source: Topdown Charts

emerging market breadth

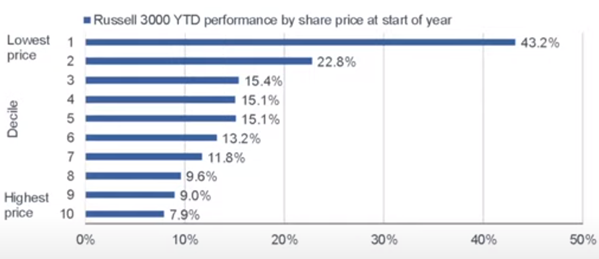
The cheaper the better. The biggest theme of recent months has been that the less money a company makes, and the cheaper its share price, the more it attracts volume and buying interest. And some still insist that markets are rational. Source: Charles Schwab via Liz Ann Sonders

low priced small cap stocks

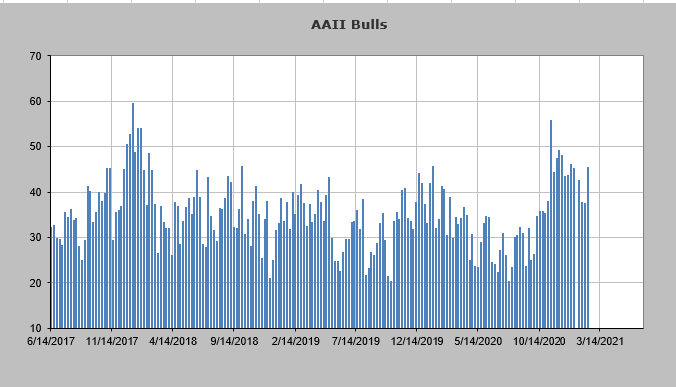
Old people are coming back. The latest AAII survey showed that the (primarily) over 50 crowd of investors has decided to join all the youngsters in pushing stocks ever higher. Source: AAII via Helene Meisler

aaii bull

PRODUCTS
SentimenTrader
Trading Tools
Indicators & Data API
‍
Strategies & Scanner
‍
Research Reports
FREE
RESOUrCES
Simple Backtest
Calculator
Simple Seasonality
Calculator
The Kelly Criterion
Calculator
Sentiment Geo Map
‍
Public Research Reports
‍
Education
Sentiment Indicators
‍
Technical Indicators
‍
Pricing
Bundle pricing
‍
FAQ
‍
Announcements
‍
COMPANY
‍
About
‍
In the News
‍
Testimonials
‍
Client Success Stories
CONTACT
‍
General Inquiries
‍
Media Inquiries
‍
Financial Professionals Inquiries
‍
© 2026 Sundial Capital Research Inc. All rights reserved.
Setsail Marketing
TermsPrivacyAffiliate Program
Risk Disclosure: The information and tools provided are for research and analytical purposes only and are not intended as investment advice. Market analysis involves uncertainty, and outcomes may differ from expectations. Users should conduct their own due diligence and consider their individual circumstances before making any financial decisions. Past performance is not necessarily indicative of future results.

Hypothetical Performance Disclosure: Hypothetical performance results have many inherent limitations, some of which are described below. No representation is being made that any account will or is likely to achieve profits or losses similar to those shown; in fact, there are frequently sharp differences between hypothetical performance results and the actual results subsequently achieved by any particular trading program. One of the limitations of hypothetical performance results is that they are generally prepared with the benefit of hindsight. In addition, hypothetical trading does not involve financial risk, and no hypothetical trading record can completely account for the impact of financial risk of actual trading. for example, the ability to withstand losses or to adhere to a particular trading program in spite of trading losses are material points which can also adversely affect actual trading results. There are numerous other factors related to the markets in general or to the implementation of any specific trading program which cannot be fully accounted for in the preparation of hypothetical performance results and all which can adversely affect trading results.

Testimonial Disclosure: Testimonials appearing on this website may not be representative of other clients or customers and is not a guarantee of future performance or success.