
Speculative trader actions adding to favorable weight of the evidence

Key points
- The IPO / S&P 500 Relative Ratio Rank indicator recently crossed a critical threshold
- Retail option traders recently experienced a spasm of fear
- This fear was reflected in the action of the ROBO Put/Call Ratio and Equity Put/Call Ratio indicators
IPO / S&P 500 Relative Ratio Rank crosses a threshold
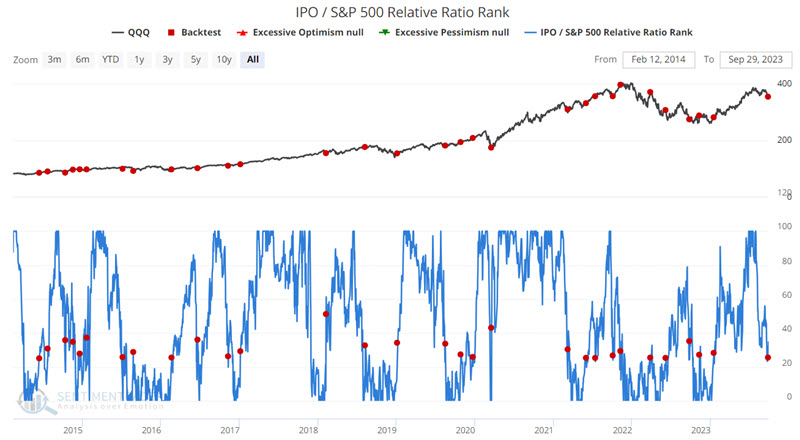
This indicator looks at the performance of an Initial Public Offerings (IPO) index relative to the S&P 500 Index. It shows where the ratio is relative to its range over the past four months. When the relative ratio is high, investors are showing risk-on behavior. When the ratio drops to a low level, they are exhibiting risk-off behavior. Rather than focusing here on extremes, let's focus on those occasions when the indicator value crossed above 25. The most recent signal occurred on 2023-09-26.
The chart below highlights those dates when the IPO/S&P 500 Relative Ratio Rank indicator crossed above 25, and the table summarizes subsequent performance for ticker QQQ.
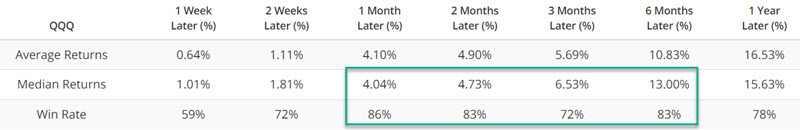
The results qualify as "good, but not necessarily great." Win Rates above 80% are something I look for as a sign of good reliability. At the same time, we are reminded that no individual signal is a "sure thing." While this is not a signal that should be relied upon as a standalone trading model, it does add weight to the bullish side of the case within a broader weight of the evidence approach.
ROBO Put/Call Ratio forms a setup
Per our website:
ROBO is an acronym we coined for Retail-Only, Buy-to-Open.
This ratio focuses on small traders to better understand what they're trying to do. When looking at put/call information, it is helpful to see if the volume is going into opening or closing transactions, as it will tell us how aggressive the traders are in betting on a market move. Also, especially for very small traders, buying options to open is more telling than selling options to open.
A small trader buys a call option to open a position for one reason - he thinks his stock is going higher. He buys a put option to open because he thinks his stock is going down. You may argue that he's trying to hedge some underlying stock position, but it doesn't matter. If he thinks his stock is going up, he won't buy a put just for the thrill of it.
If we isolate the trades to just those of 10 contracts or less and further restrict it to buys and opening transactions only, we can get an accurate picture of what retail traders (i.e., small brokerage firm customers) are doing.
This ratio looks at transactions that are buy-to-open only and only for those trades that are under ten contracts. Therefore, it is an excellent read on the emotions of the smallest of traders and should be interpreted in a contrary manner.
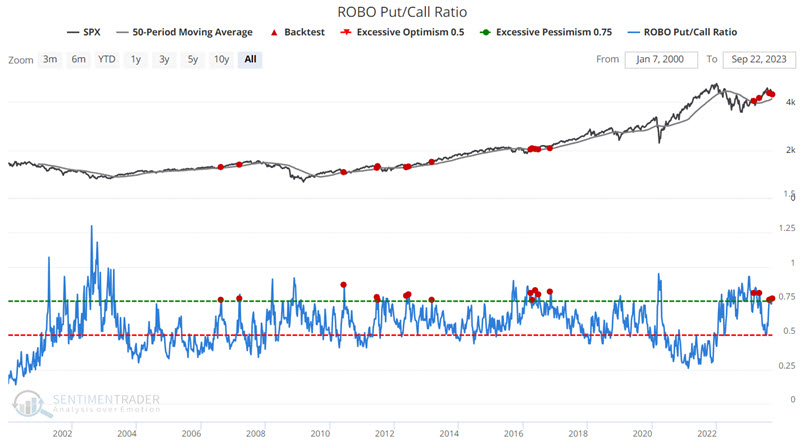
When the ROBO put/call ratio is high, small traders are buying many puts in relation to calls which suggests that they believe their stocks will decline. This is bullish for the market once it reaches an extreme. On the other hand, when these traders are so confident of their stocks rising that the ROBO ratio drops to a low level, we need to be aware that sentiment is becoming too frothy, and a market decline may soon be at hand.
The chart below highlights those dates when the ROBO Put/Call Ratio crossed above 0.75 while the S&P 500 Index was above its 50-day moving average. The most recent signal occurred on 2023-09-22.
The table below summarizes post-signal S&P 500 performance.
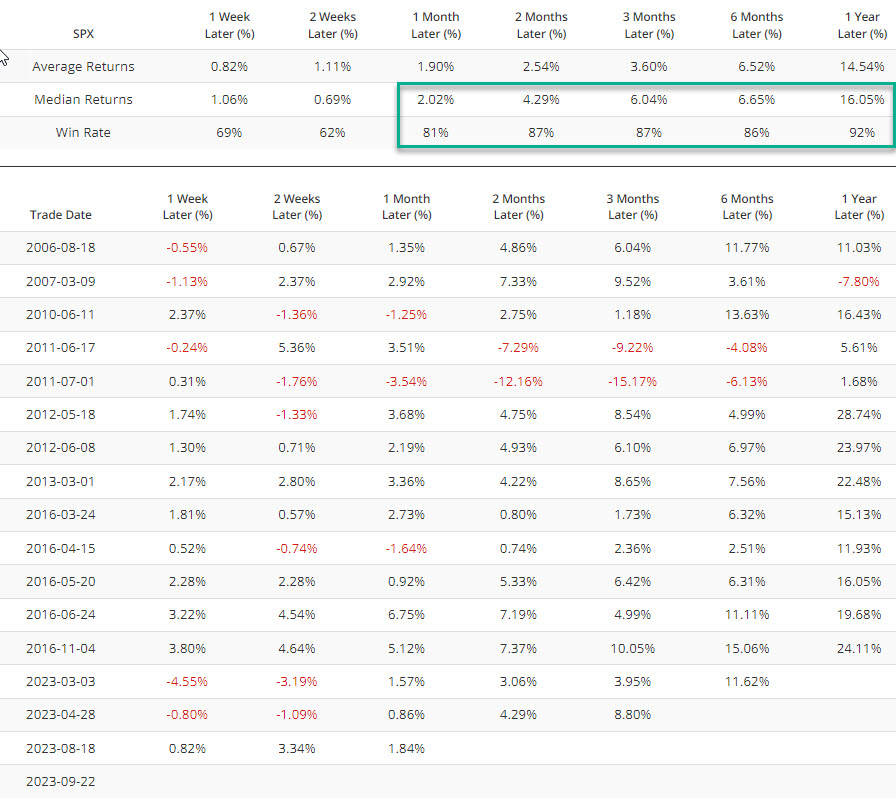
Once again, this should not be considered an automatic buy signal. It has, however, generally served as a useful "buy on the dip" indicator in the past.
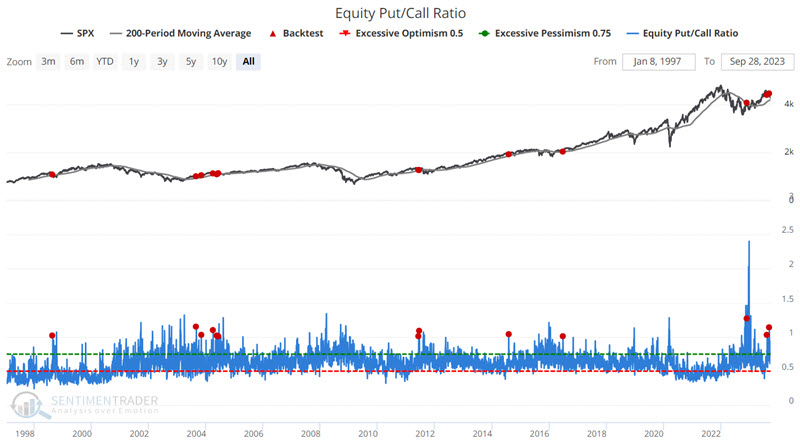
The Equity Put/Call ratio suggests modestly higher prices ahead
The Equity Put/Call ratio indicator measures the volume of puts divided by the volume of calls traded on individual equities on the CBOE (Chicago Board Options Exchange) on a given day. Focusing only on individual equities removes much of the portfolio hedging done by large traders and institutions using index options to hedge against an adverse movement by the overall stock market.
The chart below highlights those dates when the Equity Put/Call Ratio crossed above 1.00 while the S&P 500 Index was above its 200-day moving average. The most recent signal occurred on 2023-09-13.
The table below summarizes post-signal S&P 500 performance.
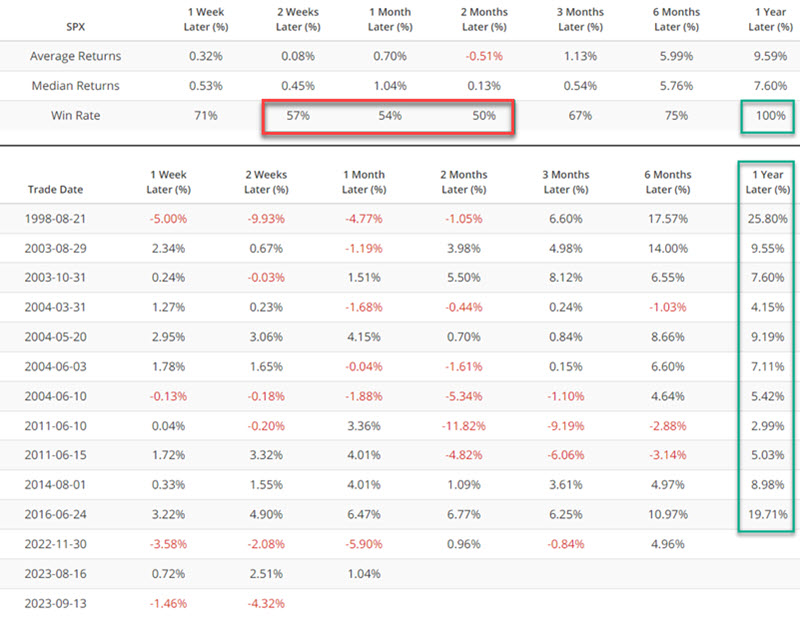
The results are not overwhelmingly favorable. Nevertheless, they may offer helpful insight in helping investors set expectations. Historically, Median Returns and Win Rates have been modest - and somewhat hit or miss - for the first three months after a signal. 12-month returns, on the other hand, have (so far) shown a 100% Win Rate. That's the good news. The less good news is that the 12-month Median Return is a relatively modest +7.6%.
Each signal is its own roll of the dice. That said, perhaps the message being sent is to ignore the loudest voices in the financial press (i.e., the most rampantly bullish and ardently bearish) and to prepare for more of a "grind higher" in the year ahead.
What the research tells us…
Not every squiggle from every indicator means something. Likewise, not every indicator signal should be relied upon as a "buy" or "sell" signal. We generally prefer a weight-of-the-evidence approach. When a meaningful number of generally reliable indicators flash similar signals within a given period, it often (though notably, not always) provides an essential clue for investors looking to cut through the latest narrative in the financial news. The recent indicator signals highlighted above add weight to the favorable side of the ledger.