Data &
Technology
Research
Reports
Report Solutions
Reports Library
Actionable
Strategies
Free
Resources
Simple Backtest Calculator
Simple Seasonality Calculator
The Kelly Criterion Calculator
Sentiment Geo Map
Public Research Reports
Free Webinar
Pricing
Company
About
Meet Our Team
In the News
Testimonials
Client Success Stories
Contact
Log inLoginSign up
< BACK TO ALL REPORTS

S&P notches yet another big intraday gain

Jason Goepfert
2020-04-29
Small-cap stocks aren't the only ones rallying. The large-cap S&P 500 index has enjoyed 6 straight sessions with at least a 1% gain at some point during the day, even if the gains fizzle by the close. These bouts of buying pressure are common during bear markets, and stocks need to hold gains to prove it's something other than that.

Small-cap stocks have stolen the spotlight by enjoying a record run of days with more than a 1% daily gain. The broader market has rallied, as well, even if giving up some of those gains on an intraday basis.

Over the past 6 days, the S&P 500 has traded higher by at least 1% at some point during the day. That's the longest streak since 2011 and has been exceeded only a few times in the nearly 40 years. It was more common prior to the early 1980s, at least if we can rely on intraday from data back then.

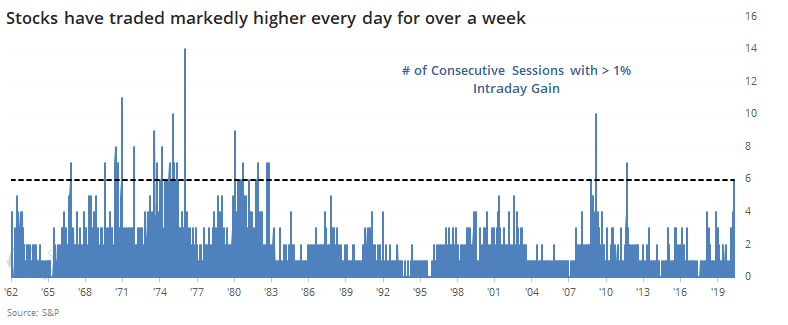
Most of these streaks occurred during downtrends when volatility was higher. If we look for any time the streak lasted 6 days while the S&P was trading below its 200-day average, then we get the following.

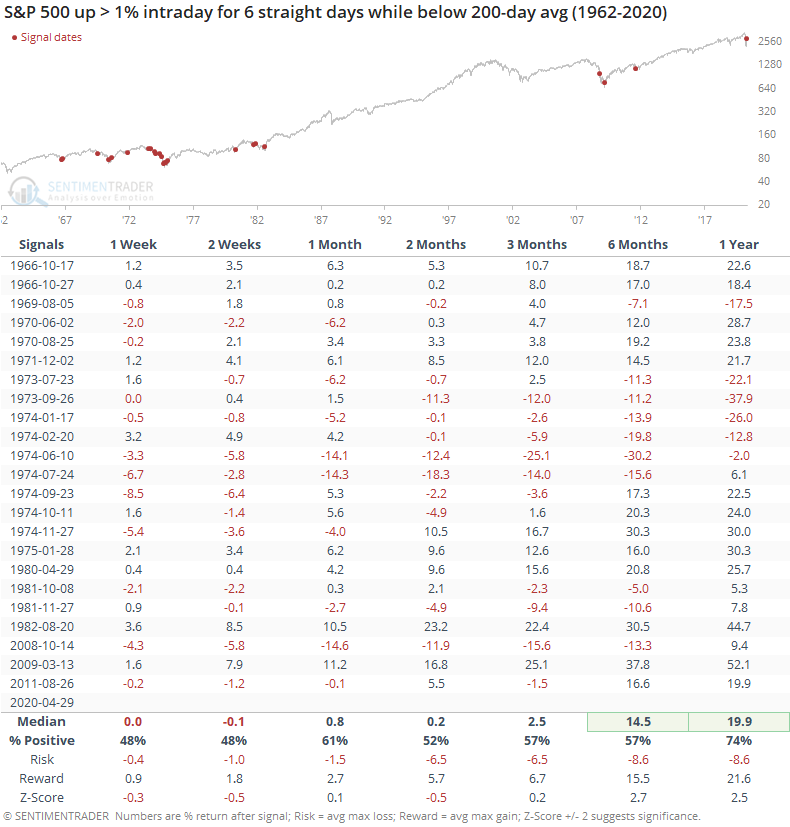
These thrusts led to some back-and-forth over the short-term as buyers took a breather. By a month later, returns turned more consistently positive and they were significantly so over the next 6-12 months. Since these instances suggest thrusts within bear markets, it makes sense that the long-term returns were above average.

Using a traded vehicle like a futures contract provides more accurate intraday data, so let's look at the same set of streaks going back to their inception in 1982.

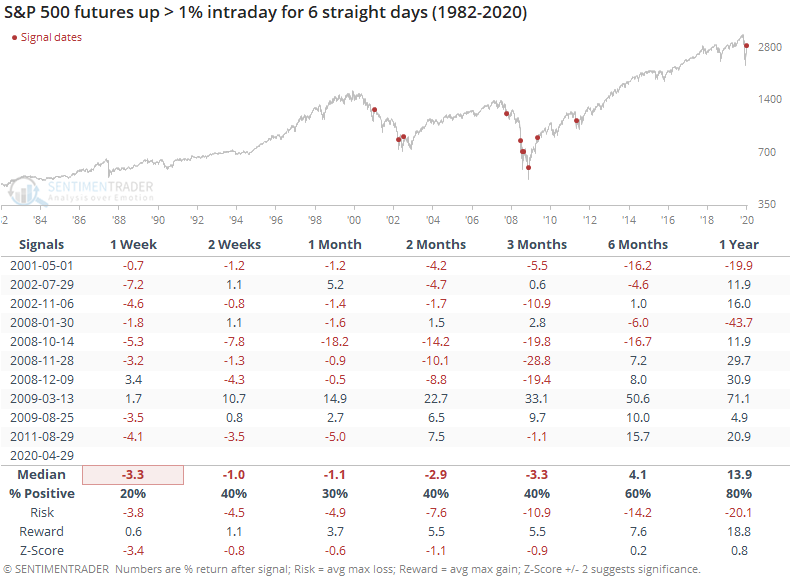
We don't need to stipulate that they were trading below the 200-day average, because all of them were. And most of them were at least a temporary head-fake. The only signal that didn't show a negative return at some point was the kick-off to the new bull market in March 2009. That one rocketed higher and just kept going.

So, if we see something similar in the coming week(s) it will give at least a little more credence to the idea that we've witnessed something other than just another bear market rally.

Sorry, you don't have access to this report

Upgrade your subscription plan to get access
Go to Dasboard
DATA &
TECHnologies
IndicatorEdge
‍
BackTestEdge
‍
Other Tools
‍
DataEdge API
RESEARCH
reports
Research Solution
‍
Reports Library
‍
actionable
Strategies
Trading Strategies
‍
Smart Stock Scanner
‍
FREE
RESOUrCES
Simple Backtest
Calculator
Simple Seasonality
Calculator
The Kelly Criterion
Calculator
Sentiment Geo Map
‍
Public Research Reports
‍
Free Webinar
COMPANY
‍
About
‍
Meet our Team
‍
In the News
‍
Testimonials
‍
Client Success Stories
Pricing
Bundle pricing
‍
Announcements
‍
FAQ
© 2024 Sundial Capital Research Inc. All rights reserved.
Setsail Marketing
TermsPrivacyAffiliate Program
Risk Disclosure: Futures and forex trading contains substantial risk and is not for every investor. An investor could potentially lose all or more than the initial investment. Risk capital is money that can be lost without jeopardizing ones’ financial security or life style. Only risk capital should be used for trading and only those with sufficient risk capital should consider trading. Past performance is not necessarily indicative of future results.

Hypothetical Performance Disclosure: Hypothetical performance results have many inherent limitations, some of which are described below. No representation is being made that any account will or is likely to achieve profits or losses similar to those shown; in fact, there are frequently sharp differences between hypothetical performance results and the actual results subsequently achieved by any particular trading program. One of the limitations of hypothetical performance results is that they are generally prepared with the benefit of hindsight. In addition, hypothetical trading does not involve financial risk, and no hypothetical trading record can completely account for the impact of financial risk of actual trading. for example, the ability to withstand losses or to adhere to a particular trading program in spite of trading losses are material points which can also adversely affect actual trading results. There are numerous other factors related to the markets in general or to the implementation of any specific trading program which cannot be fully accounted for in the preparation of hypothetical performance results and all which can adversely affect trading results.

Testimonial Disclosure: Testimonials appearing on this website may not be representative of other clients or customers and is not a guarantee of future performance or success.