Products
SentimenTrader Trading Tools
‍
Backtest Engine
My Trading Toolkit
Correlation Analysis
Seasonality
Market Prediction
Indicators & Data API
‍
Proprietary Indicators & Charts
Market Data API
Strategies & Scanner
‍
50+ Trading Strategies
Smart Stock Scanner
Smart Option Scanner
Research Reports
‍
Research Solutions
Reports Library
Free Resources
Simple Backtest Calculator
Simple Seasonality Calculator
The Kelly Criterion Calculator
Sentiment Geo Map
Public Research Reports
Education
Sentiment Indicators
Technical Indicators
Pricing
Company
About
In the News
Testimonials
Client Success Stories
Contact
Log inLoginSign up
< BACK TO ALL REPORTS

S&P 500 winning streak is another bear killer

Dean Christians
2022-08-17
The S&P 500 has closed above its 10-day moving average for 21 consecutive sessions. The successive days above the average comes after an oversold condition. A component in the TCTM composite confirmation model, which identifies this pattern triggered a new buy signal on Tuesday.

Key points:

  • The S&P 500's winning streak above its 10-day average triggered a buy signal
  • After similar streaks, the S&P rallied 78% of the time over the next 12 months
  • After a 20% decline, the S&P 500 rallied 94% of the time over the next 12 months

Persistent win streaks above a moving average are indicative of uptrends, not downtrends

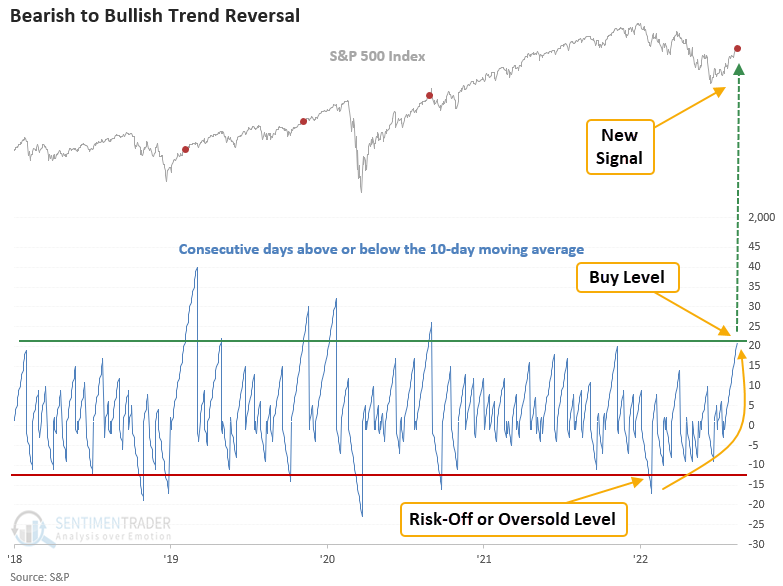
A new signal from a voting member in the TCTM Composite Confirmation Model issued an alert at the close of trading on Tuesday. The component is called the moving average bearish to bullish reversal streak.

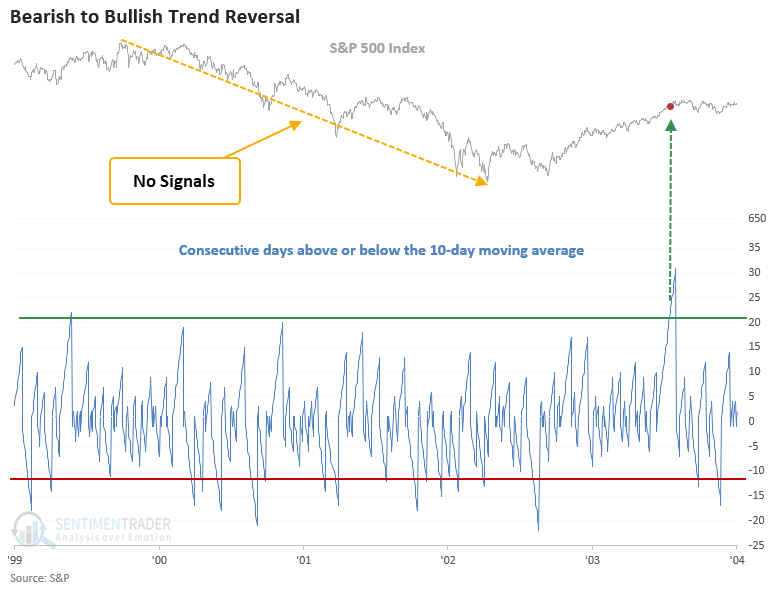
The win streak model is simple. It first identifies a period whereby the S&P 500 closes below its 10-day average for a minimum of 12 consecutive sessions. i.e., an oversold condition. Once that condition is achieved, the model will trigger a buy signal when the index sustains itself above the 10-day average for 21 successive sessions.

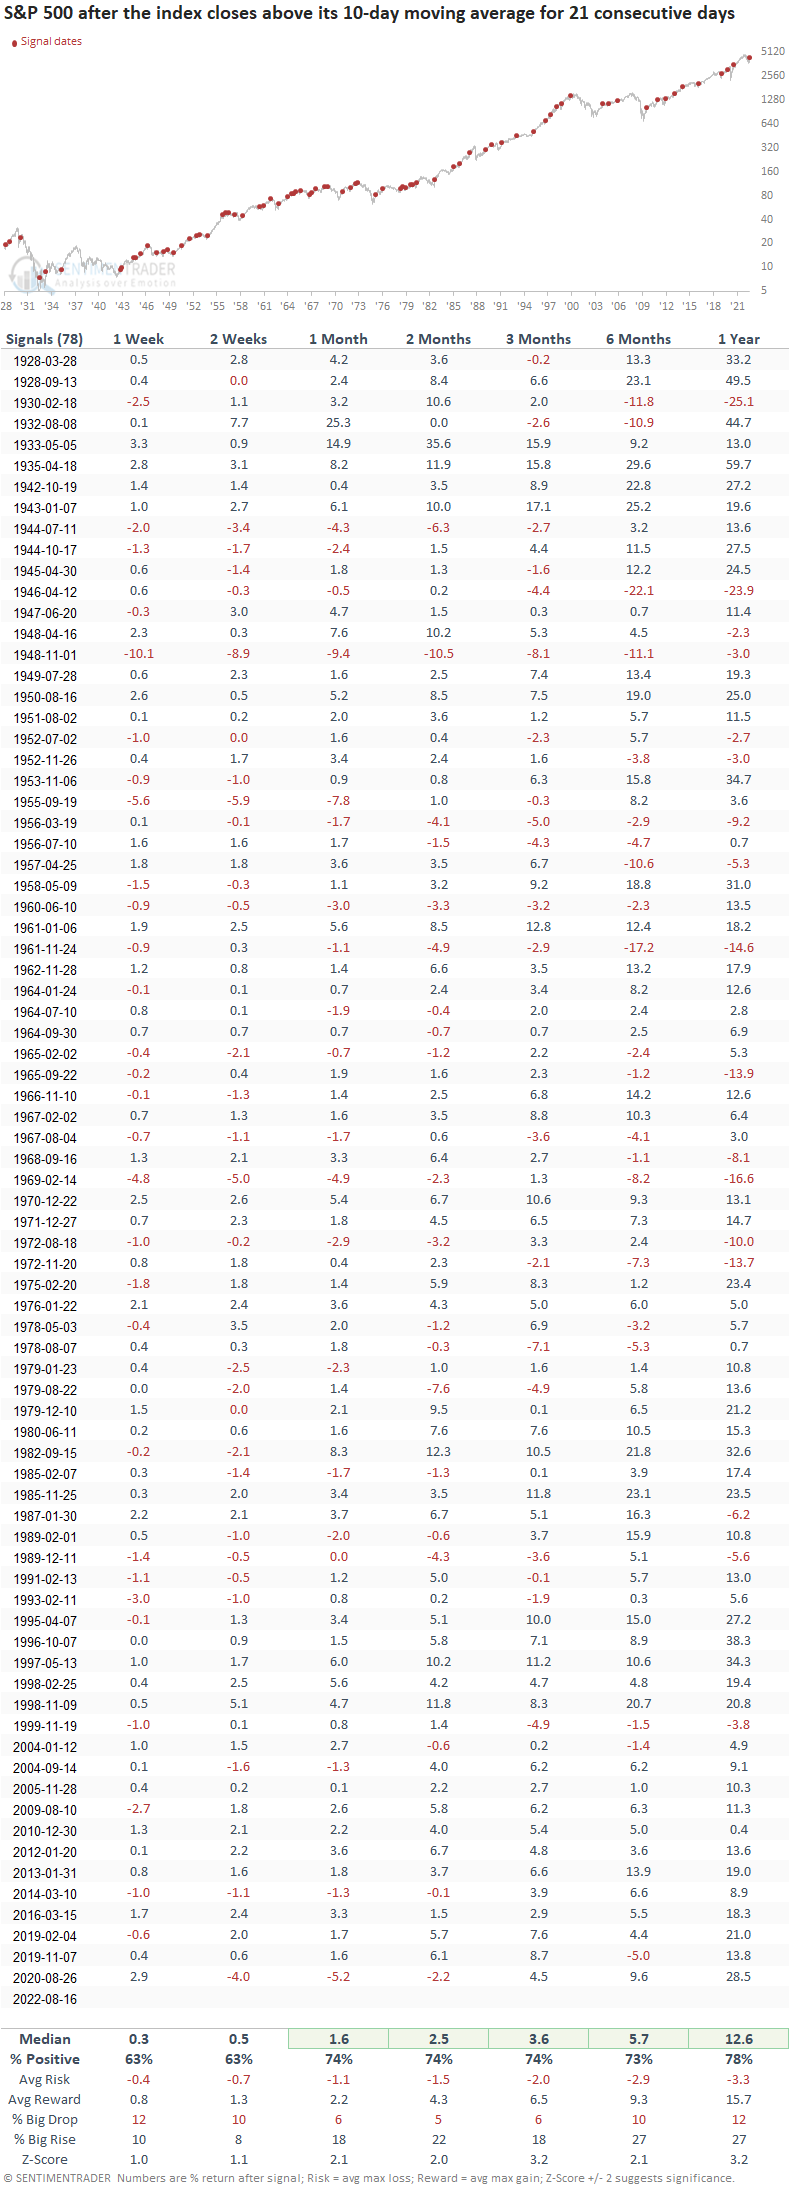
Similar signals preceded gains 78% of the time a year later

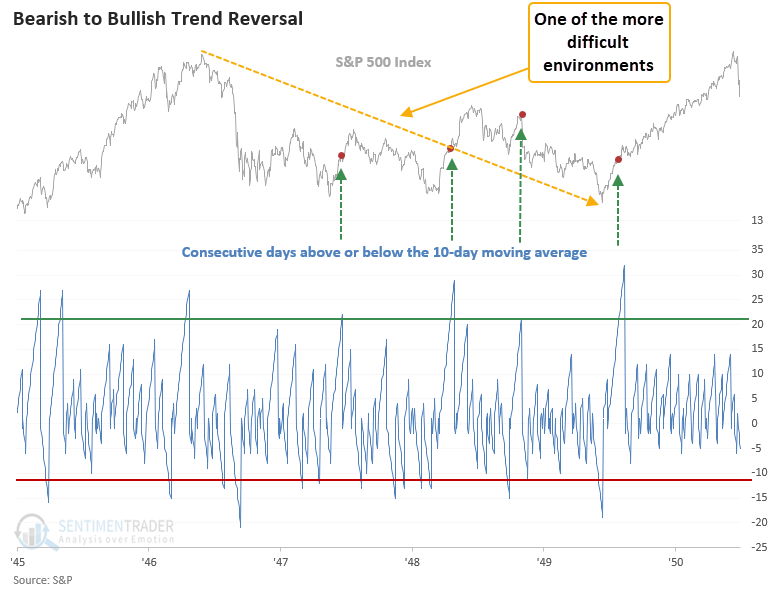
The win streak model generated a signal 78 other times over the past 95 years. After the others, S&P 500 future returns, win rates, and z-scores were excellent across medium and long-term time frames. Consistency looks impressive, with only one signal showing a negative return across all time frames, which occurred in 1948. 

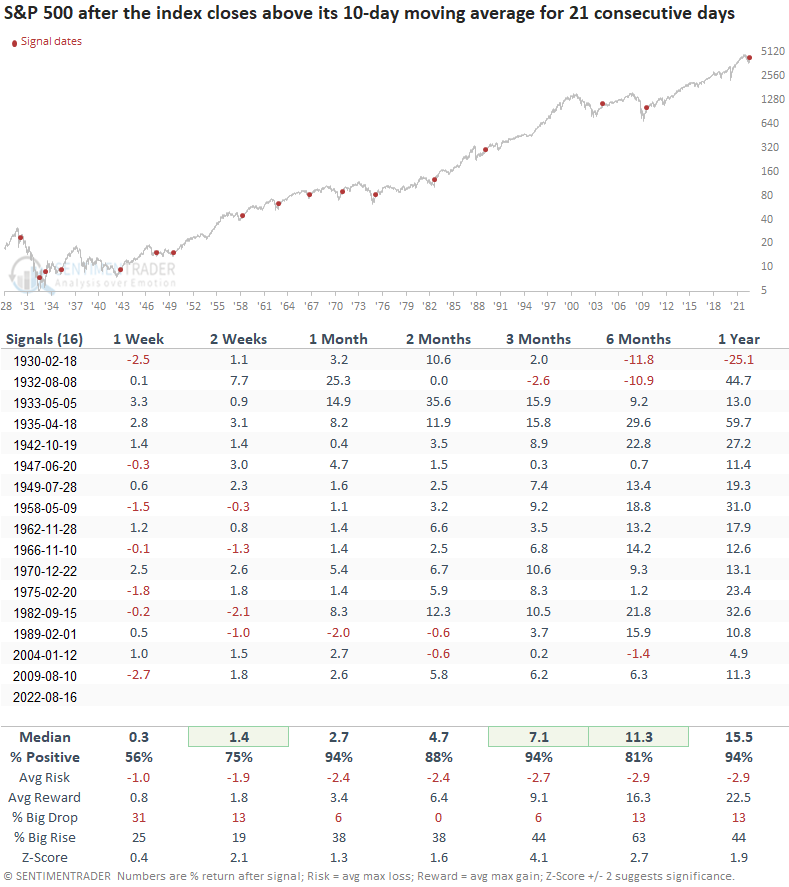
First signal after a 20% decline from a high

If I isolate instances after the S&P 500 closed down 20% or more, the model identified 16 other signals in the last 93 years. Once again, consistency looks excellent, with several windows showing a win rate of 94%. Besides the 1930 signal, drawdowns were minimal across all time frames.

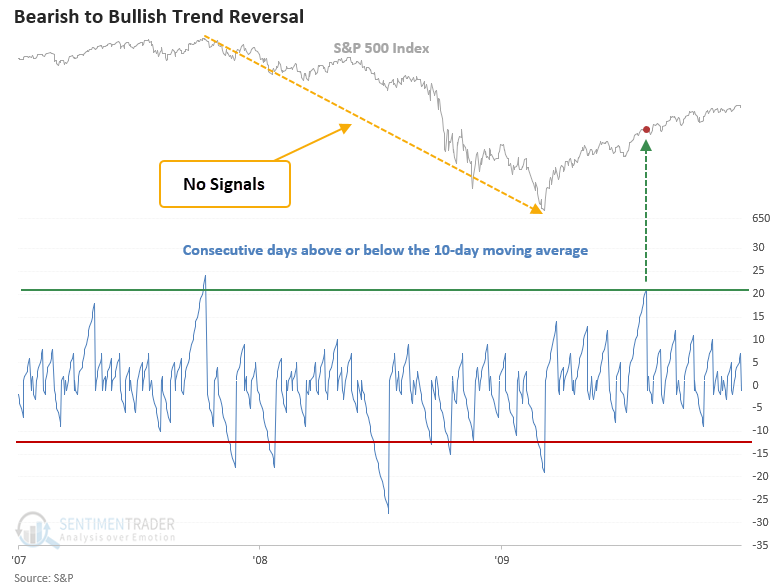
Win streaks rarely occur in bear markets 

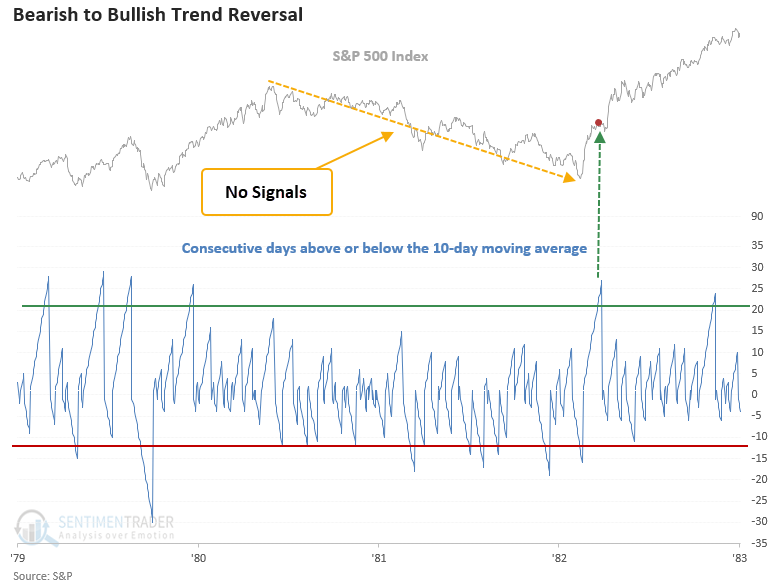
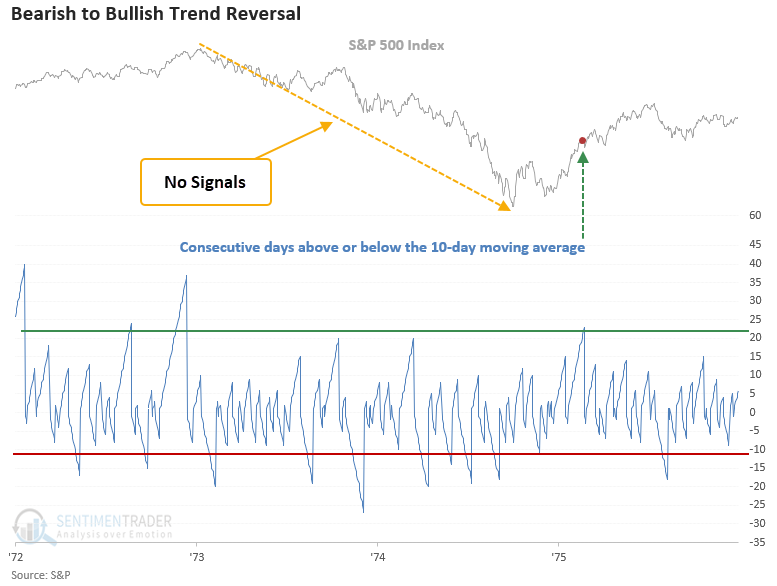
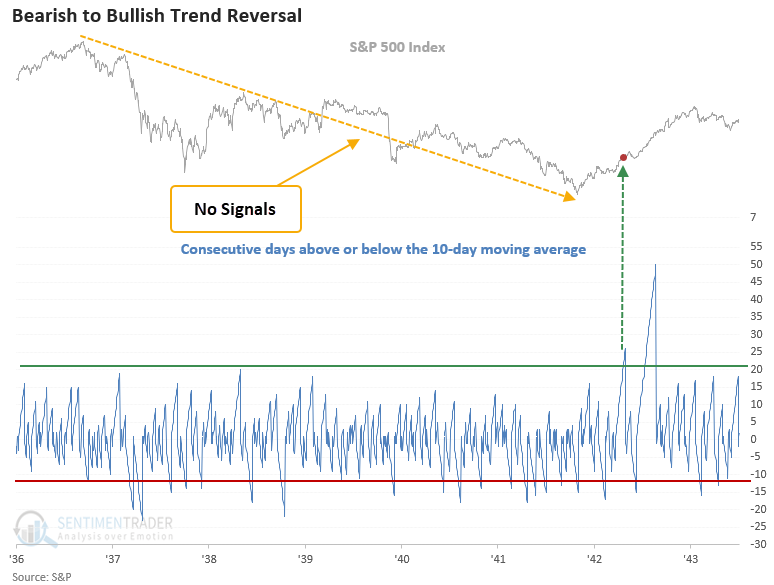
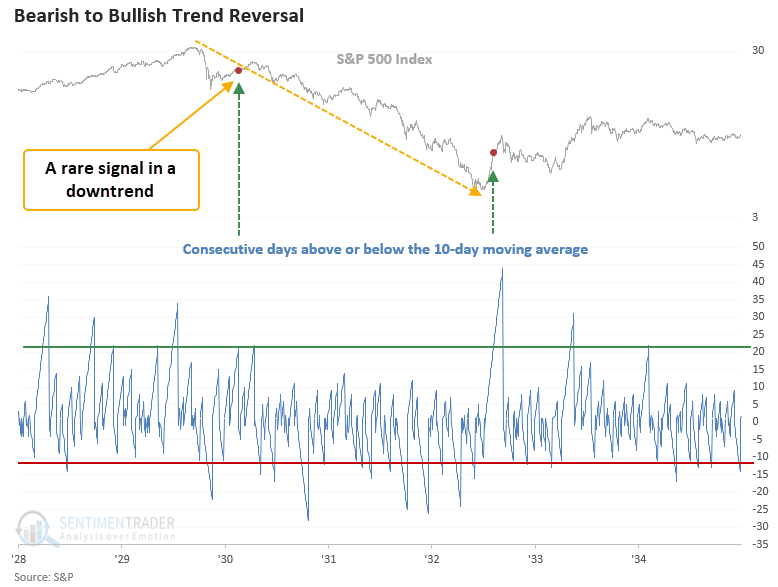
Suppose we review some historical bear market charts. In that case, we see that signals rarely occur in downtrends. The win streak model is a component in the composite confirmation model because it's less likely to identify a trend reversal before other more timely indicators like breadth thrusts.

2007-08 chart example

2000-02 chart example

1980-82 chart example

1973-74 chart example

1946-49 chart example

1938-42 chart example

1929-32 chart example

What the research tells us...

When the stock market is in a downtrend or in the early stages of forming a bottom, price action is volatile, and indices rarely sustain themselves above a short-term moving average for an extended period. The win streak model seeks to identify a transition from a bearish risk-off period to a bullish risk-on uptrend. Since the June low, bullish market signals have predominantly come from breadth-based indicators. With the new win streak signal, we now have confirmation at the index level from a price-based measure, which is a good thing.

PRODUCTS
SentimenTrader
Trading Tools
Indicators & Data API
‍
Strategies & Scanner
‍
Research Reports
FREE
RESOUrCES
Simple Backtest
Calculator
Simple Seasonality
Calculator
The Kelly Criterion
Calculator
Sentiment Geo Map
‍
Public Research Reports
‍
Education
Sentiment Indicators
‍
Technical Indicators
‍
Pricing
Bundle pricing
‍
FAQ
‍
Announcements
‍
COMPANY
‍
About
‍
In the News
‍
Testimonials
‍
Client Success Stories
CONTACT
‍
General Inquiries
‍
Media Inquiries
‍
Financial Professionals Inquiries
‍
© 2026 Sundial Capital Research Inc. All rights reserved.
Setsail Marketing
TermsPrivacyAffiliate Program
Risk Disclosure: The information and tools provided are for research and analytical purposes only and are not intended as investment advice. Market analysis involves uncertainty, and outcomes may differ from expectations. Users should conduct their own due diligence and consider their individual circumstances before making any financial decisions. Past performance is not necessarily indicative of future results.

Hypothetical Performance Disclosure: Hypothetical performance results have many inherent limitations, some of which are described below. No representation is being made that any account will or is likely to achieve profits or losses similar to those shown; in fact, there are frequently sharp differences between hypothetical performance results and the actual results subsequently achieved by any particular trading program. One of the limitations of hypothetical performance results is that they are generally prepared with the benefit of hindsight. In addition, hypothetical trading does not involve financial risk, and no hypothetical trading record can completely account for the impact of financial risk of actual trading. for example, the ability to withstand losses or to adhere to a particular trading program in spite of trading losses are material points which can also adversely affect actual trading results. There are numerous other factors related to the markets in general or to the implementation of any specific trading program which cannot be fully accounted for in the preparation of hypothetical performance results and all which can adversely affect trading results.

Testimonial Disclosure: Testimonials appearing on this website may not be representative of other clients or customers and is not a guarantee of future performance or success.