
S&P 500 stocks reaching a 21-day high saw a substantial increase

Key points:
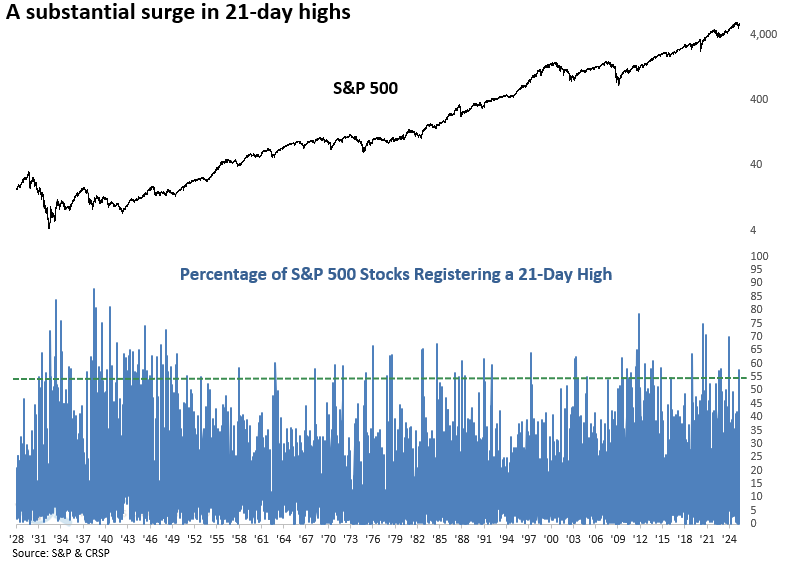
- The percentage of S&P 500 stocks registering a 21-day high surged above 54%
- Comparable momentum in new highs saw the S&P 500 rally, with improved outcomes since 1950
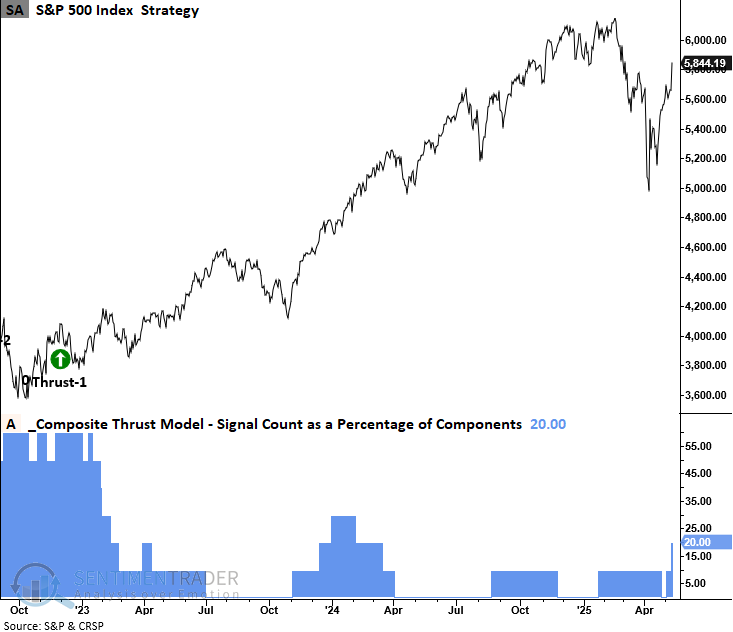
- With the new alert, the TCTM Composite Thrust Model signal count increased to 20%
Additional evidence supports the case for a cyclical uptrend in stocks
Following the weekend trade talks between the U.S. and China, stocks surged in response to optimism around cooperation. The rally triggered a thrust signal from one of the TCTM Composite Thrust Model components. This indicator measures the percentage of stocks reaching a 21-day high. When it exceeds 54%, as it did on Monday, it has historically signaled a favorable environment for equities.
The previous signal occurred in December 2023, leading to substantial S&P 500 gains over the next six months.
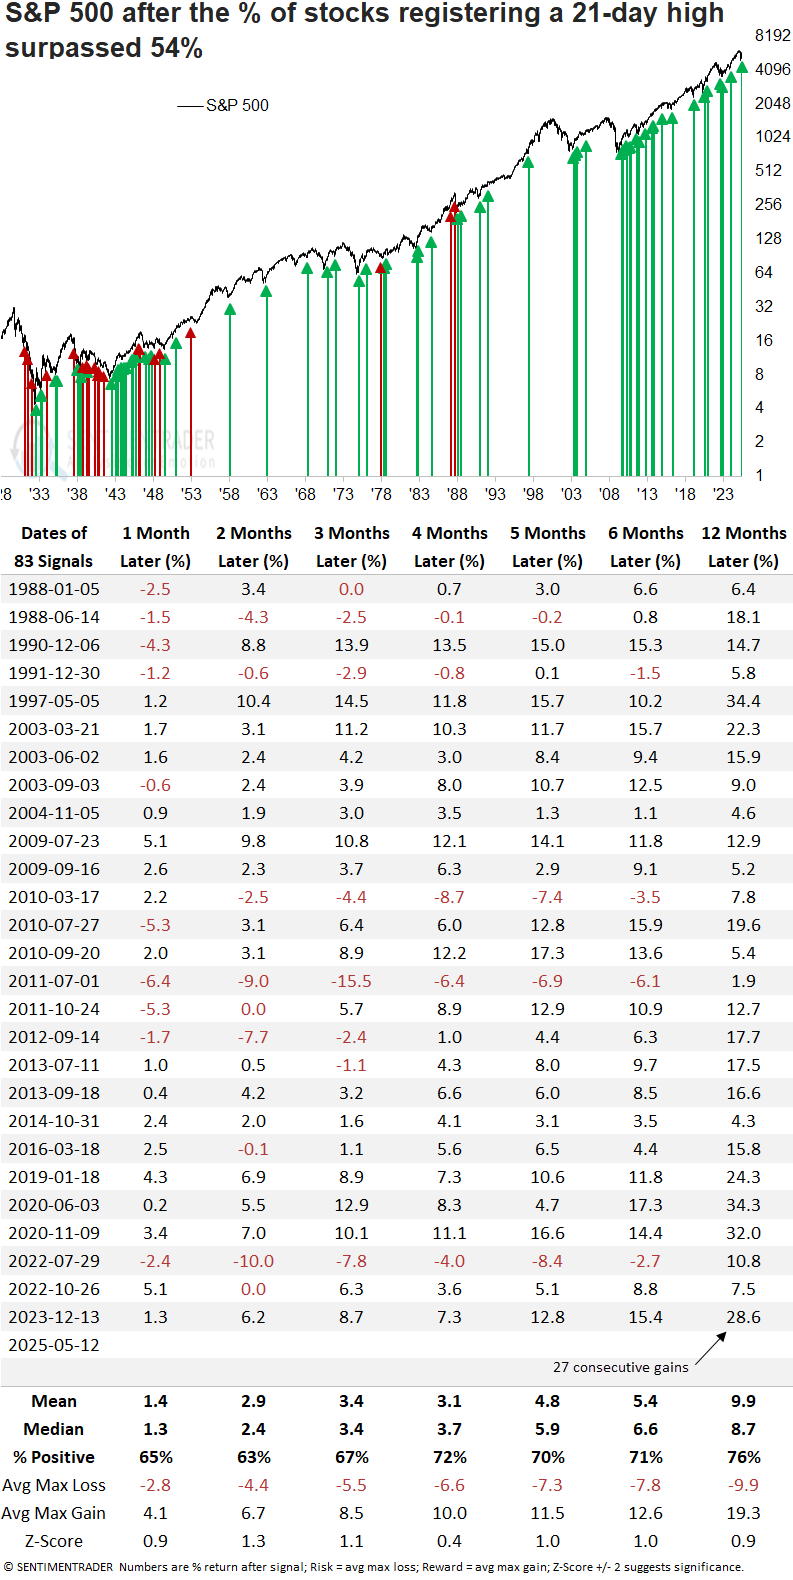
Comparable surges in 21-day highs preceded a bullish outcome
While returns and win rates following a surge in 21-day highs may seem unimpressive at first glance, it's important to note that the secular bear market from 1929 to 1942 weighed heavily on the results. Excluding that period, performance since 1950 has improved markedly, with the world's most benchmarked index lower a year later only four times, as shown by the red arrows in the chart.
Since 1988, the S&P 500 has posted gains one year later in every occurrence.
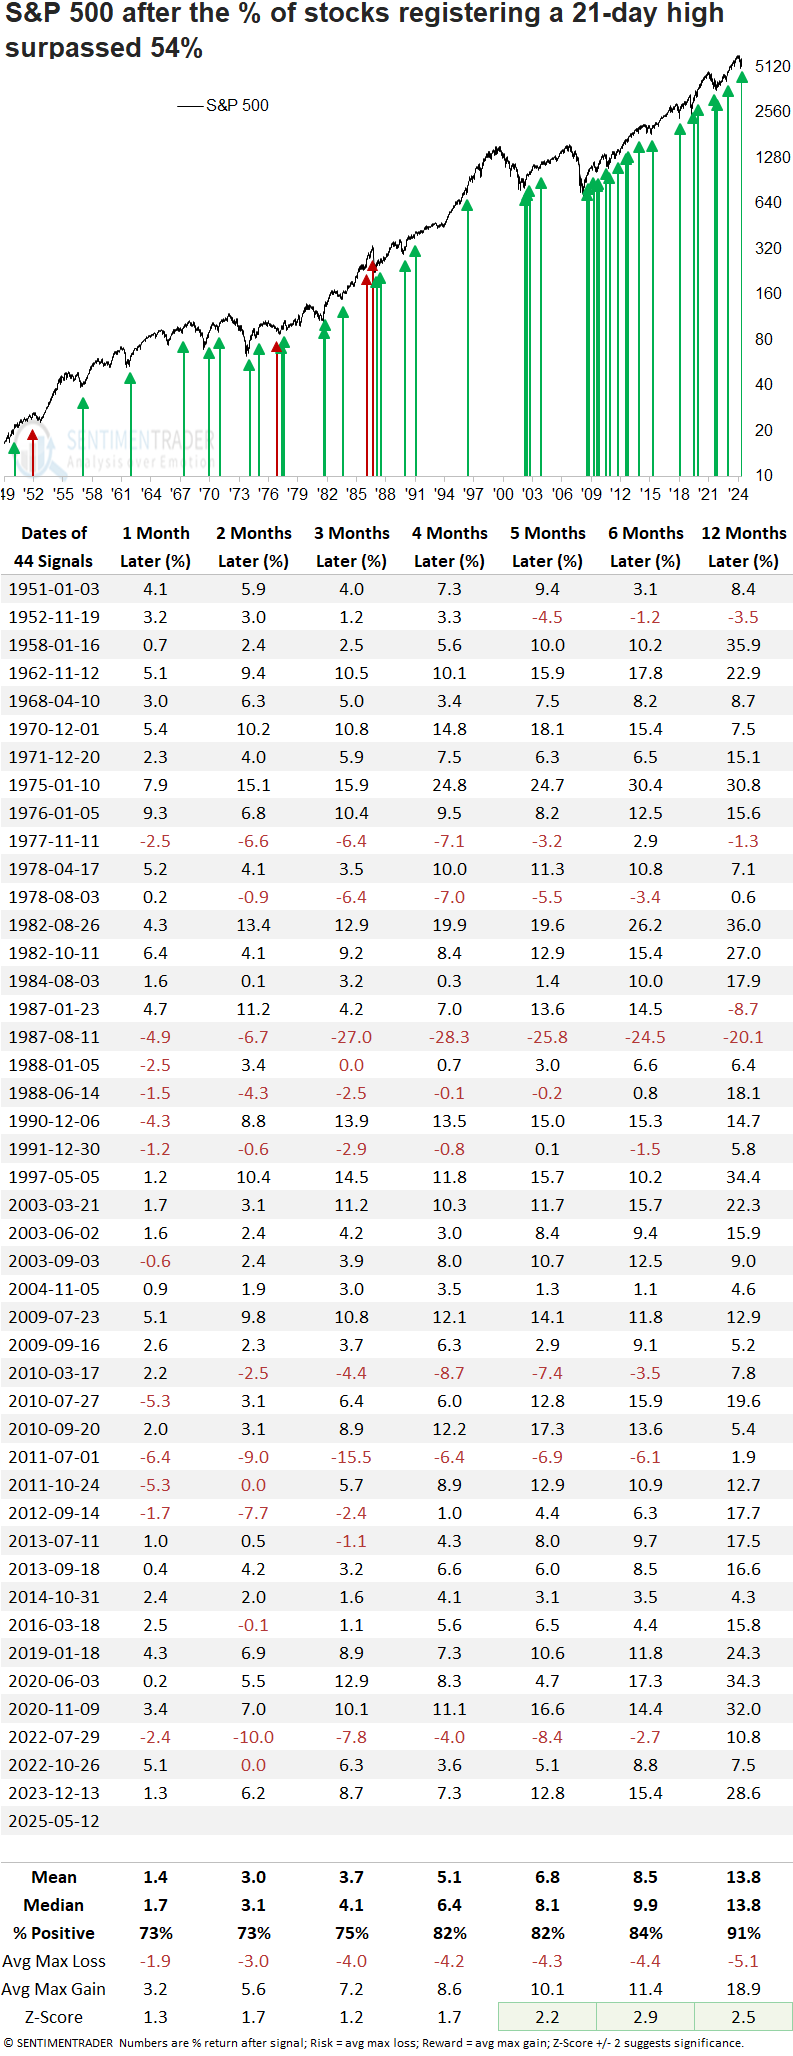
Since 1950, signals have demonstrated markedly improved returns and consistency, with every timeframe showing a win rate above 70% and several surpassing 80%. Furthermore, the five, six, and twelve-month windows displayed significance relative to random returns.
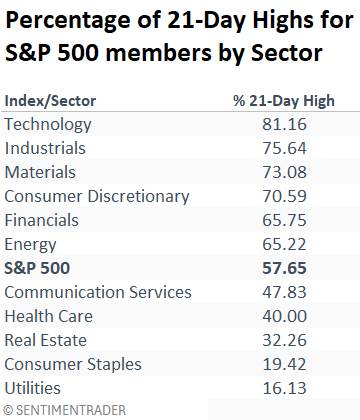
Cyclical sectors are driving the expansion in new highs
It should come as no surprise that cyclical sectors dominate the list of new highs, a scenario often seen during the early phase of a cyclical recovery. Every time consumer discretionary, financials, industrials, and technology had at least 65% of their stocks hitting 21-day highs on the same day, as they did on Monday, the S&P 500 was higher one year later without exception.
Tactical Composite Trend Model
The signal count for the TCTM Thrust Model rose to 20% following the 21-day high surge alert. While it's unclear if a broad composite signal will trigger, the percentage of overbought issues and those above their 50-day averages are the most likely components to push it higher if upside momentum persists.
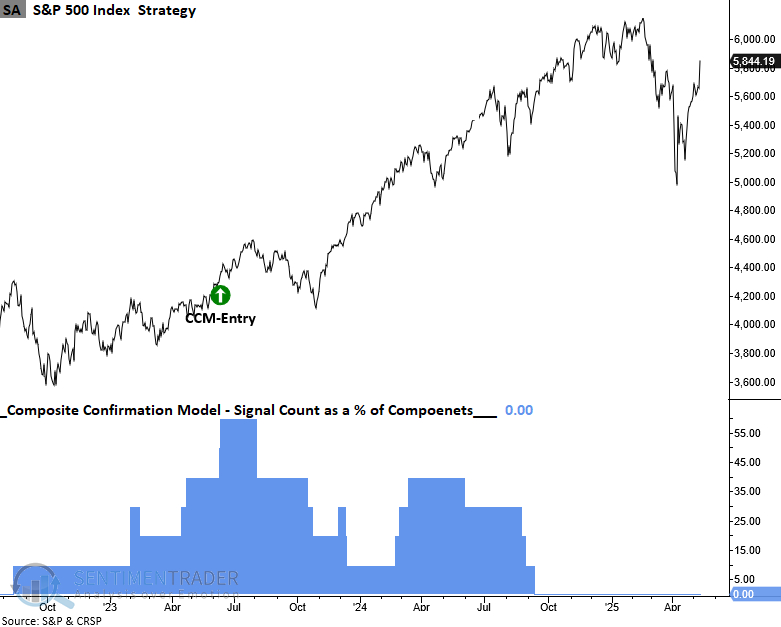
Should the S&P 500 maintain its upward trajectory, components within the TCTM Composite Confirmation Model, which integrates long-term breadth, price momentum, and trend metrics, will likely trigger alerts, confirming a potential transition from a bearish to bullish cycle.
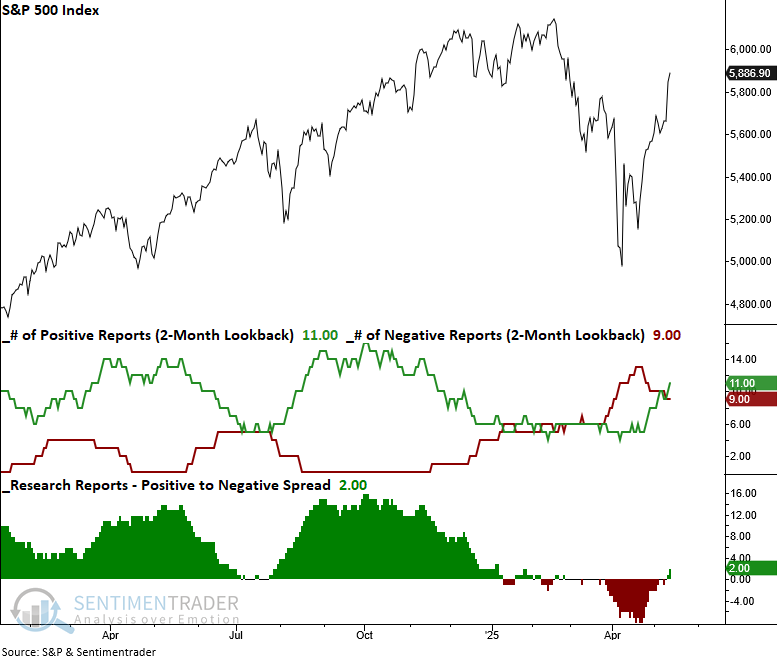
A bullish shift in research reports
Following a stretch dominated by bearish reports, the tide has turned, with bullish reports gaining the upper hand. Given current market conditions, this trend will likely persist as breadth, momentum, and trends strengthen.
What the research tells us...
The percentage of S&P 500 stocks reaching a 21-day high recently surged above 54%, a notable threshold that has historically foreshadowed a favorable market environment over medium- to long-term horizons. This breadth thrust reflects a broadening rally, with participation expanding well beyond a handful of leaders. Historically, such surges have preceded sustained market advances, especially in the aftermath of the 1929-1942 secular bear market, where similar signals marked the early stages of durable uptrends. With this development, the TCTM Composite thrust signal count rose to 20%, underscoring a marked improvement in the market backdrop and signaling a potential shift toward a more constructive phase for equities.