S&P 500 Spread Between 21-Day Highs & Lows

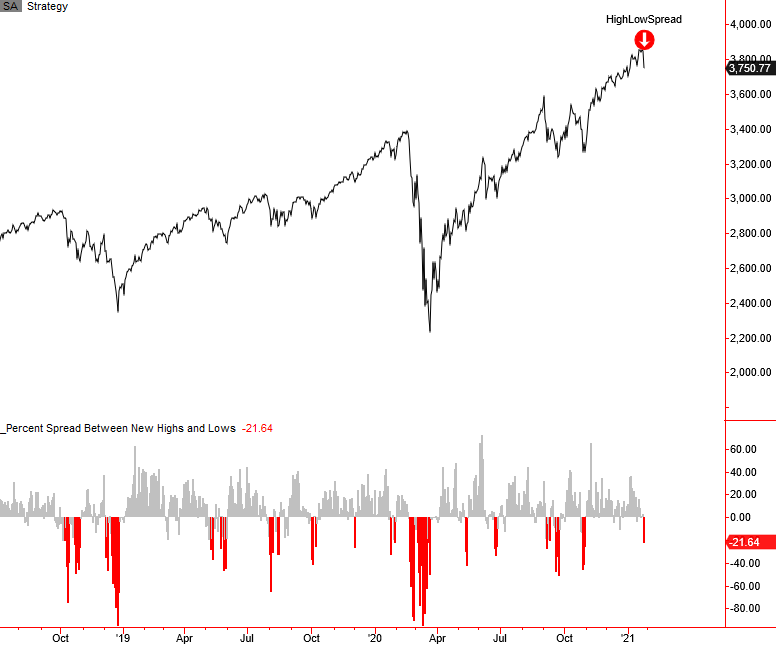
The spread between 21-day highs and lows for S&P 500 members crossed below -20% on 1/27/21. The signal occurred within two days of a high and when the Index was down less than 3% from a 252-day high.
Let's take a look at all instances since 1933.
Current Day Chart and Signal
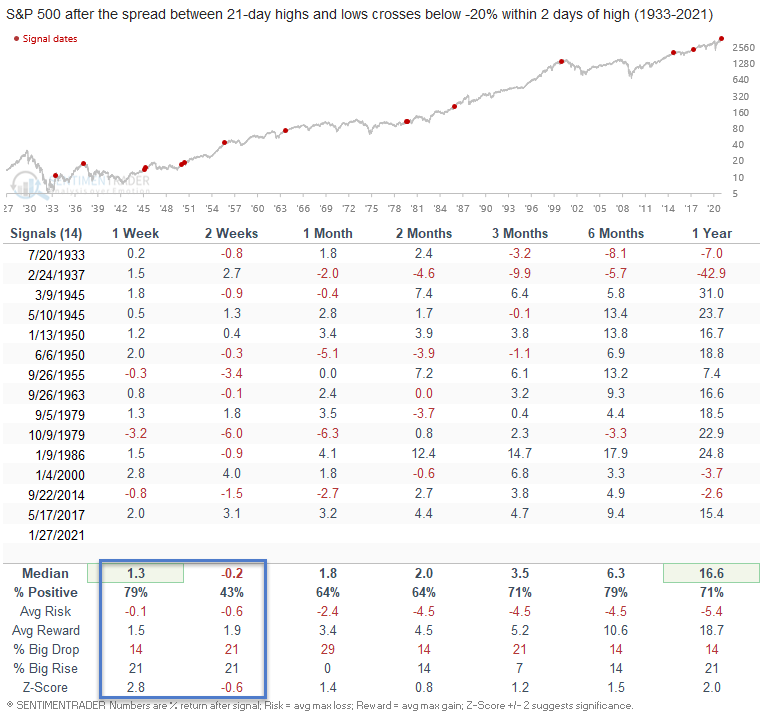
Signal Performance
As the table below shows, the S&P 500 tended to snapback over the next week. Some weakness then followed the rally in the two-week timeframe.