Products
SentimenTrader Trading Tools
‍
Backtest Engine
My Trading Toolkit
Correlation Analysis
Seasonality
Market Prediction
Indicators & Data API
‍
Proprietary Indicators & Charts
Market Data API
Strategies & Scanner
‍
50+ Trading Strategies
Smart Stock Scanner
Smart Option Scanner
Research Reports
‍
Research Solutions
Reports Library
Free Resources
Simple Backtest Calculator
Simple Seasonality Calculator
The Kelly Criterion Calculator
Sentiment Geo Map
Public Research Reports
Education
Sentiment Indicators
Technical Indicators
Pricing
Company
About
In the News
Testimonials
Client Success Stories
Contact
Log inLoginSign up
< BACK TO ALL REPORTS

S&P 500 sailing into a brief headwind

Jay Kaeppel
2023-06-14
The stock market strength in recent weeks has come as a surprise to many investors. Now that things appear to be moving in the right direction, a short seasonal period pops up as a potential short-term headwind. This piece highlights the history of this trend and several possible strategies for short-term traders and long-term investors.

Key points

  • Seasonality is climate, not weather
  • Likewise, the annual seasonal trend for any security is a measure of the past, not a roadmap for the current year
  • That said, the stock market has entered a period that has witnessed weakness more often than not
  • The bottom line: A pullback or consolidation shortly should not come as a surprise

The mid-year lull

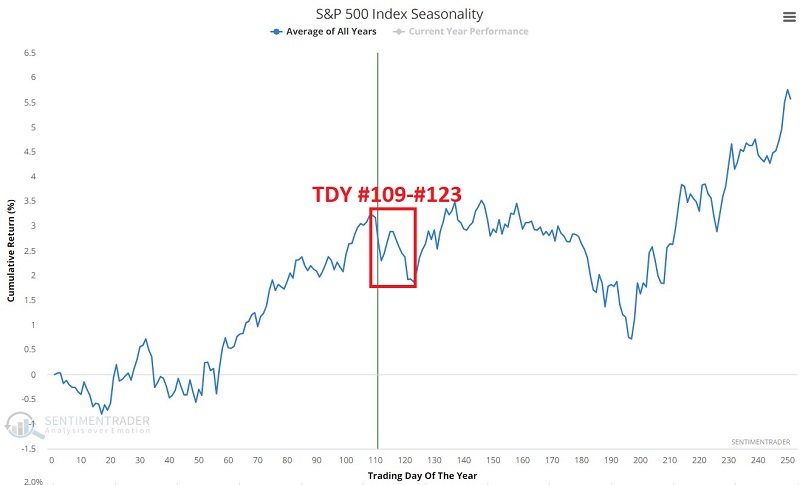
The chart below displays the annual seasonal trend for the S&P 500 Index. The period between Trading Day of the Year (TDY) #109 and TDY #123 is highlighted. For 2023, this period extends from the close on 2023-06-08 through 2023-06-28. The good news is through the first three trading days of this period the S&P 500 Index has gained +1.75%.

The chart below displays the growth of $1 invested in the S&P 500 Index only from the close of TDY #109 through the close of TDY #123 every year starting in 1960.

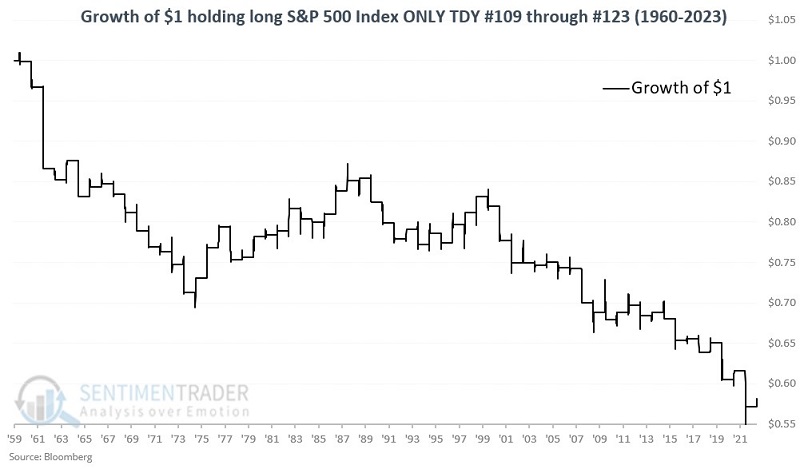
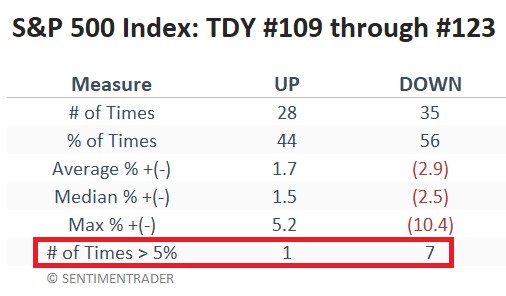
The long-term bias for weakness is unmistakable, but there is no way to predict from year-to-year how the market will perform during this period. The table below summarizes S&P 500 performance during this mid-year lull period. The key things to note are:

  • The market has been down more often than up during this period
  • Also, the down years have, on average, been more negative than the up years were positive
  • The S&P 500 has gained more than 5% only once during this period but has lost -5% or more seven times

What the research tells us…

The bad news is that there has been an unmistakable tendency for below-average performance during this brief period. The good news is that there is no guarantee that this period will experience weakness during any given year - and so far, the market has continued to power ahead through the first few days of this period in 2023.

The real question is, "What to do with this information." The simplest is "nothing." In other words, don't do anything based solely on a slight seasonal bias. On the other hand, in light of recent market strength, proactive traders might watch closely for signs of reversal and look for an opportunity to play the short side of the market via a short-term trade. Longer-term investors might pursue a variety of tactics, including 1) If you are already thinking about selling some stock positions and lightening up, you might consider selling into strength, 2) Selling some covered calls against existing stock positions in hopes of collecting some premium if the market cools off for a few weeks, and 3) Investors with cash to invest might consider "keeping their powder dry" and looking for a better buying opportunity closer to the end of June.

PRODUCTS
SentimenTrader
Trading Tools
Indicators & Data API
‍
Strategies & Scanner
‍
Research Reports
FREE
RESOUrCES
Simple Backtest
Calculator
Simple Seasonality
Calculator
The Kelly Criterion
Calculator
Sentiment Geo Map
‍
Public Research Reports
‍
Education
Sentiment Indicators
‍
Technical Indicators
‍
Pricing
Bundle pricing
‍
FAQ
‍
Announcements
‍
COMPANY
‍
About
‍
In the News
‍
Testimonials
‍
Client Success Stories
CONTACT
‍
General Inquiries
‍
Media Inquiries
‍
Financial Professionals Inquiries
‍
© 2026 Sundial Capital Research Inc. All rights reserved.
Setsail Marketing
TermsPrivacyAffiliate Program
Risk Disclosure: The information and tools provided are for research and analytical purposes only and are not intended as investment advice. Market analysis involves uncertainty, and outcomes may differ from expectations. Users should conduct their own due diligence and consider their individual circumstances before making any financial decisions. Past performance is not necessarily indicative of future results.

Hypothetical Performance Disclosure: Hypothetical performance results have many inherent limitations, some of which are described below. No representation is being made that any account will or is likely to achieve profits or losses similar to those shown; in fact, there are frequently sharp differences between hypothetical performance results and the actual results subsequently achieved by any particular trading program. One of the limitations of hypothetical performance results is that they are generally prepared with the benefit of hindsight. In addition, hypothetical trading does not involve financial risk, and no hypothetical trading record can completely account for the impact of financial risk of actual trading. for example, the ability to withstand losses or to adhere to a particular trading program in spite of trading losses are material points which can also adversely affect actual trading results. There are numerous other factors related to the markets in general or to the implementation of any specific trading program which cannot be fully accounted for in the preparation of hypothetical performance results and all which can adversely affect trading results.

Testimonial Disclosure: Testimonials appearing on this website may not be representative of other clients or customers and is not a guarantee of future performance or success.