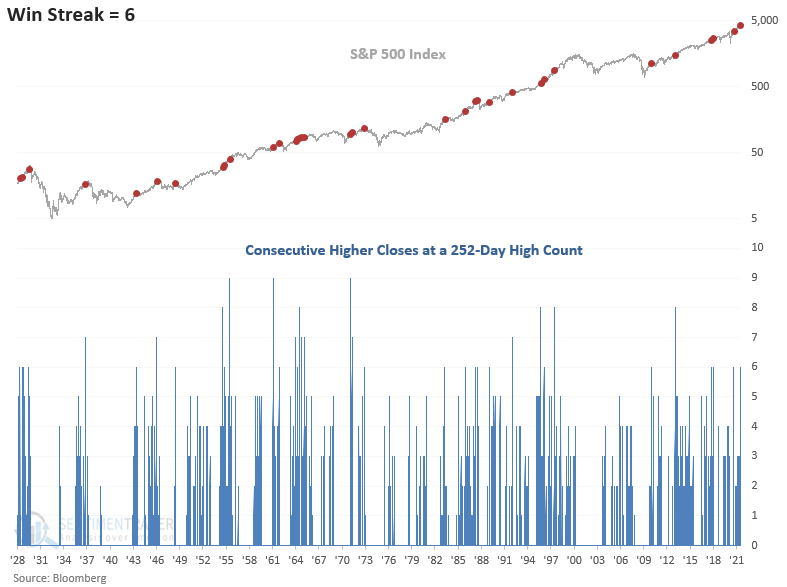
S&P 500 Consecutive 252-Day Highs

The S&P 500 Index has now closed at a new 252-day high for six consecutive days, a winning streak that has only occurred 34 other times since 1928.
Let's conduct a study to assess the forward return outlook when this pattern has emerged in the past.
HISTORICAL CHART
With the S&P 500 set to open higher today, the win streak could extend to 7 days. As the historical chart shows, the index has never exceeded nine consecutive higher closes at a 252-day high.
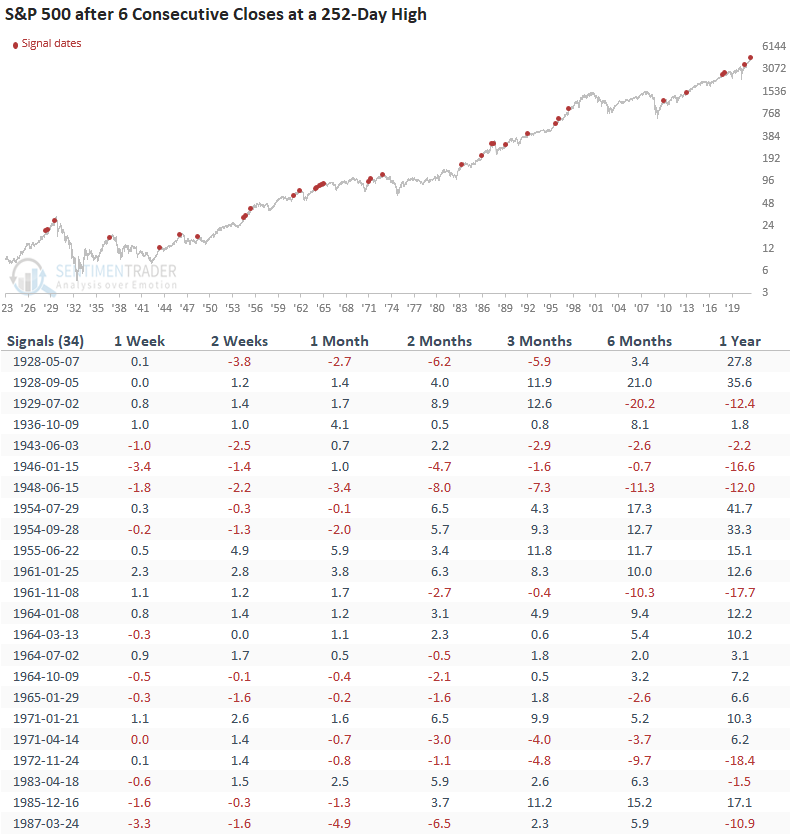
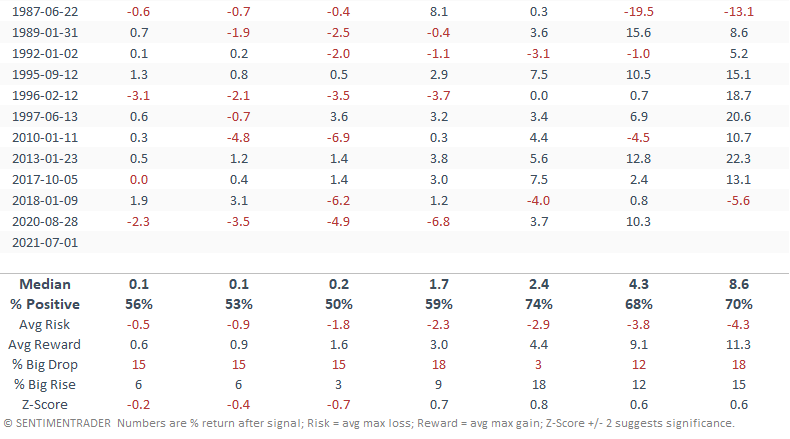
HOW THE SIGNALS PERFORMED
The returns look slightly worse in the short term as the intermediate to long-term performance looks consistent with historical study results.
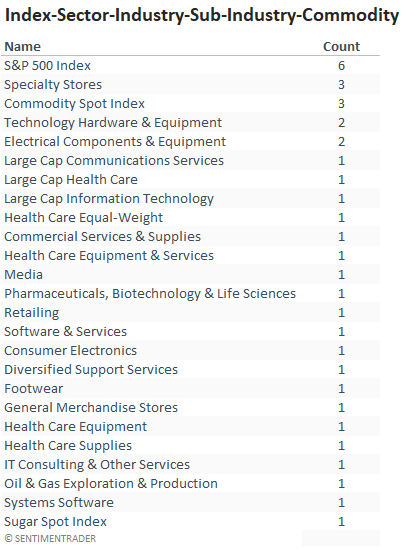
Let's see if subgroups and commodities are matching the win streak in the S&P 500.
WIN STREAK COMPARISON
When I assessed 222 stock market subgroups and commodities, the following groups are the only ones to have a one-day or more win streak at a 252-day high. The S&P 500 is on an island of its own. The analysis is one more piece of evidence that confirms how unusual the backdrop has been of late.