
S&P 500 52-week highs and the AAII Bull Ratio

Key points
- The S&P 500 has been hitting new 52-week highs recently
- At the same time, the percentage of AAII Bears has been greater than AAII Bulls
- While some are touting this as a bullish contrarian sign, the actual numbers are somewhat underwhelming
The S&P 500 versus the AAII Bull Ratio
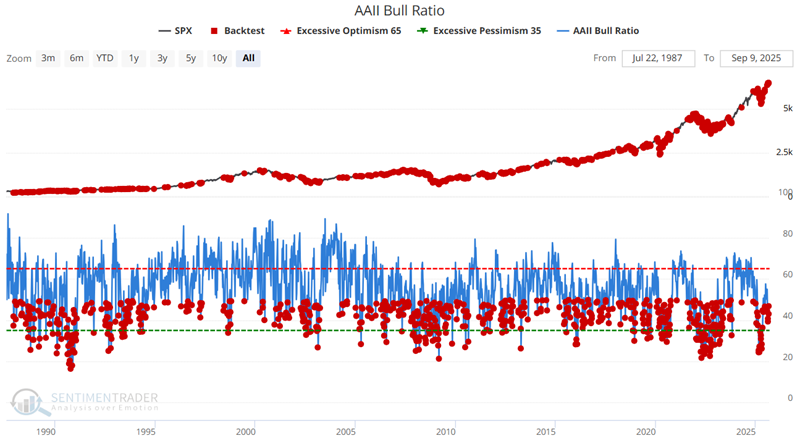
The AAII Bull Ratio measures the percentage of bullish respondents in the American Association of Individual Investors (AAII) weekly survey compared to Bulls + Bears. Technically, stocks have had a slight historical advantage when the ratio is below 50%. As sentiment tends to be a contrarian indicator, this is not surprising.
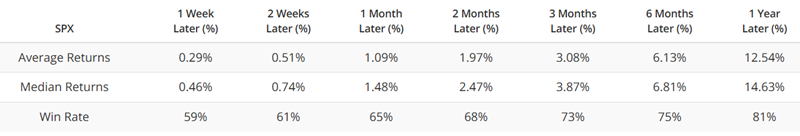
The chart and table below highlight all weeks when the AAII Bull Ratio was below 50% and summarize subsequent S&P 500 performance.
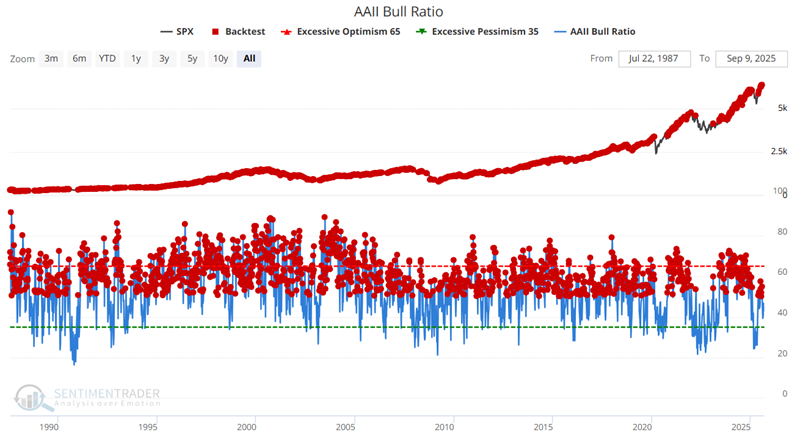
Conversely, the chart and table below highlight all weeks when the AAII Bull Ratio was above 50% and summarize subsequent S&P 500 performance.
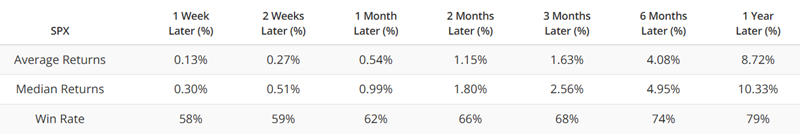
The tables below compare "below 50%" performance to "above 50%" performance. In the bottom table, note that the S&P 500 has shown slightly higher Average and Median performance and Win Rates when the AAII Bull Ratio is below 50% than when it is above 50%.
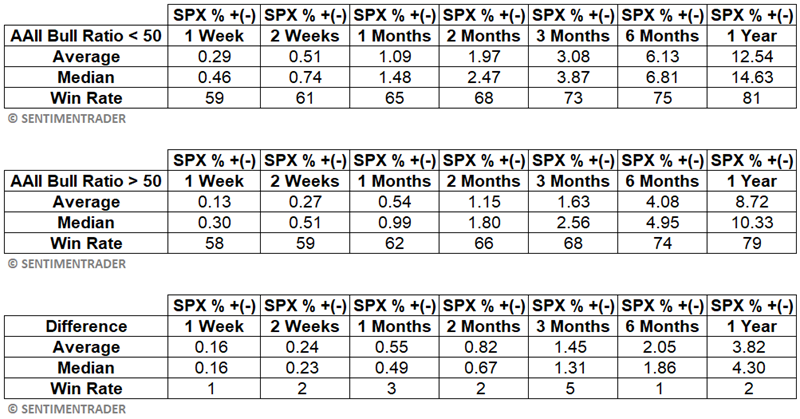
Note that overall, results generated when the AAII Bull Ratio is above 50 are not "bearish" per se, but are consistently below market results generated when the ratio is below 50.
S&P new highs with more AAII Bears than Bulls
There has been some social media chattering of late regarding the occurrence of new 52-week highs for the S&P 500, while the weekly survey from the American Association of Individual Investors (AAII) survey is showing more respondents identifying as bearish on stocks than bullish. The chatter suggests - typically without presenting any statistical proof whatsoever - that this is exceptionally bullish for stocks. Based on the numbers we showed above, this line of argument intuitively makes sense, as a lack of bullishness in the face of new highs suggests a healthy skepticism toward the recent advance. And such skepticism is generally considered to be a bullish contrarian sign.
But is an AAII Bull Ratio below 50% even more bullish if it occurs in the face of new S&P 500 highs? We decided to test the claim.
The chart below shows a weekly chart for the S&P 500 along with:
- The percentage that the S&P 500 is below a 52-week high (readings of 100% indicate a 52-week high) and
- The AAII Bull Ratio (which measures the percentage of Bulls divided by Bulls + Bears)
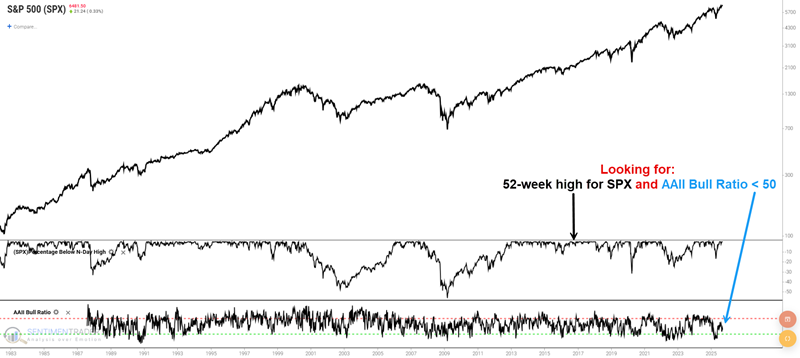
We then identified every week when:
- The S&P 500 closed at a 52-week high, and;
- The Bull Ratio was below 50
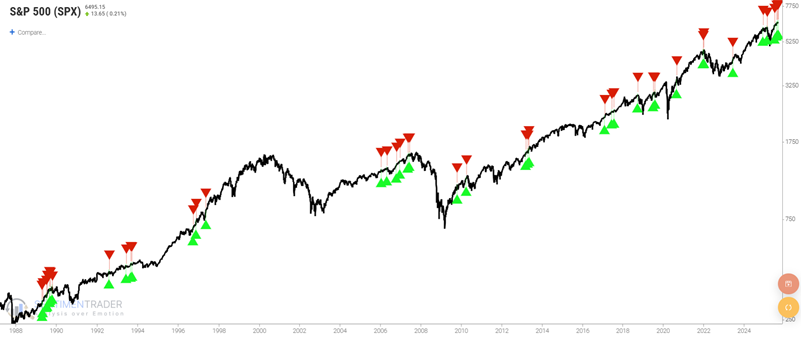
The chart below highlights these weeks with a green arrow. Anecdotally, this occurs primarily during the ongoing bull market.
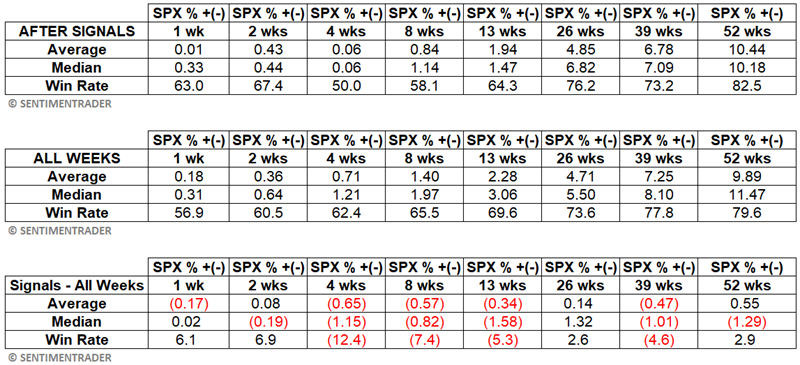
But we were curious whether actual results backed up the theory, so we ran the numbers ourselves. These results appear in the tables below. Note the extremely mixed results in the bottom table showing the difference in S&P 500 performance only after "52-week high + AAII Bull Ratio below 50%" signals versus All Weeks.
What the research tells us…
We are adamant that sentiment often offers helpful contrarian clues. The initial results shown above, comparing S&P 500 performance after AAII Bull Ratio readings below 50% versus performance following readings above 50%, offer one piece of evidence of this. However, recent claims by some pundits that a Bull Ratio reading below 50% in the face of a new 52-week high for the S&P 500 is exceptionally bullish appear to be based more on anecdotal opinion than mathematical historical results.