S&P 500 21-Day High-Low Spread Follow-Through Day

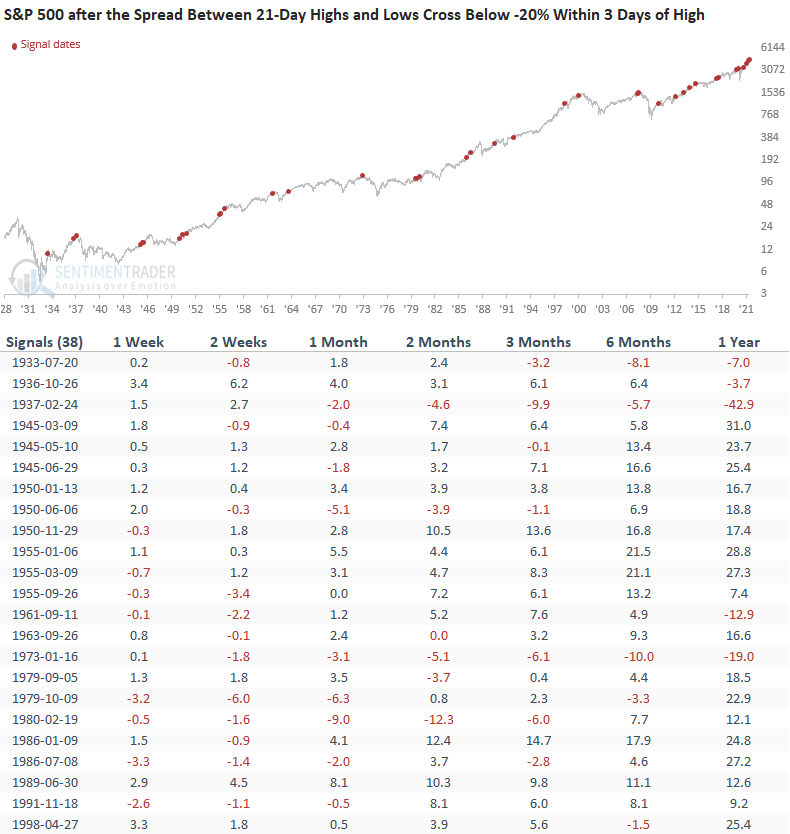
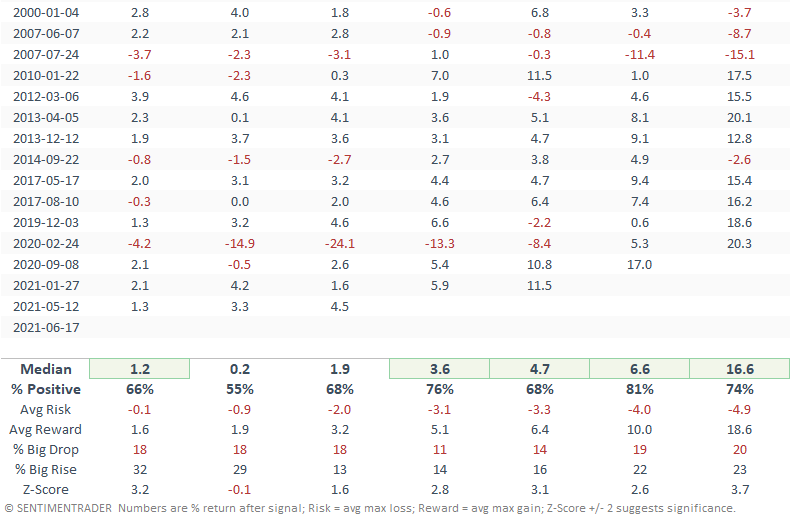
The spread between S&P 500 21-day highs and lows shifted in favor of more lows than highs last week, with a cross below -20% on Thursday. I would also note that the cross occurred within three days of a 252-day high. If we run a study to assess the forward return outlook for this pattern, the results look bullish, as the table below indicates.
HOW THE SIGNALS PERFORMED
The new high low spread study suggests a bounce this week followed by some giveback in week two. After week two, the market provides a compelling case for a move higher.
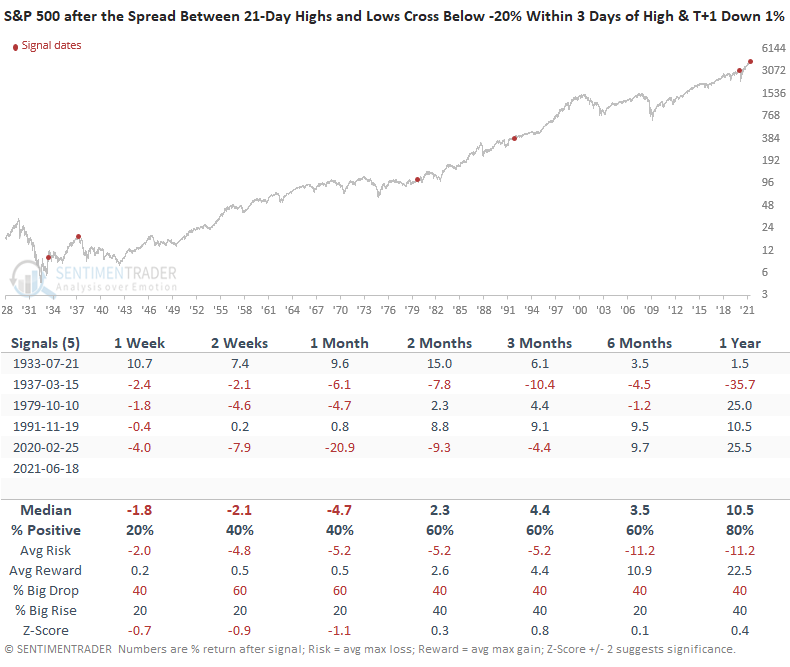
While the case for a move higher looks good, let's add one more condition to the above study. On Friday, the S&P 500 closed down over 1%. So, our new study will assess the outlook when the following happens.
- Spread crosses below -20% within three days of high
- The S&P 500 closes down 1% or more the next day
HOW THE SIGNALS PERFORMED
While the sample size is small, the results suggest that one can't rule out some additional downside in the short term.