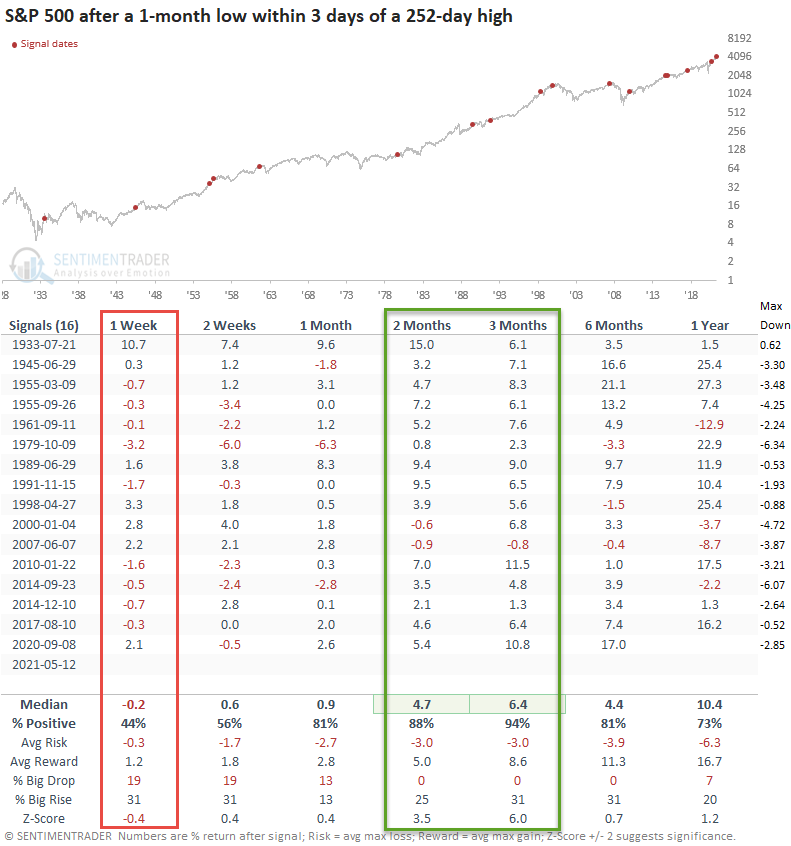
S&P 500 1-month low within 3 days of 252-day high

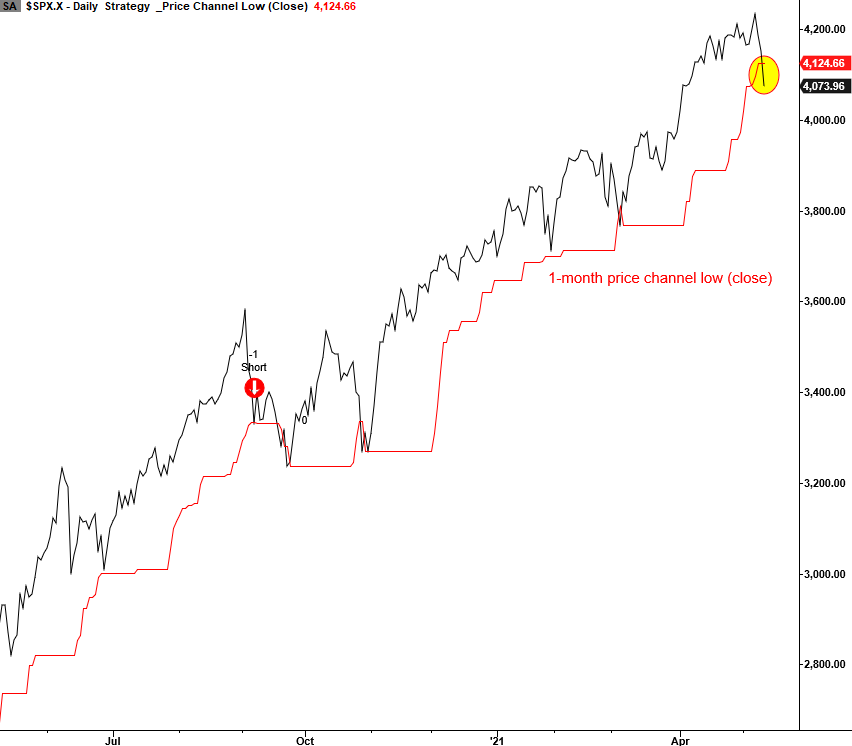
Unless the market stages a massive rally in the final minutes of trading, the S&P 500 should close at a new 1-month low within three days of a 252-day high.
Let's assess potential forward returns when this pattern has occurred in the past.
CURRENT CHART
HOW THE SIGNAL PERFORMED
The results suggest some follow-through to the downside in the near term. The last column contains the max drawdown in the first 42 days. Based on the historical average, the market could drop another 3%. However, history favors buying the dip as the 2-3 month timeframe results look solid.