
Some Warning Sign "Clouds" Gather on the Horizon

Key points:
- The trend of the stock market remains favorable, with all major average above their respective long-term moving average
- A few potential warning clouds are beginning to appear on the horizon
- For now, these warnings do not constitute an actionable signal; However, it is a good time to start paying closer attention to potential signs of trouble
The primary trend remains favorable
Looking solely at price action, it is impossible to deem the current trend of the stock market as anything but favorable. As displayed in the charts below, the major stock market indexes are all trading well above their respective 200-day moving averages.
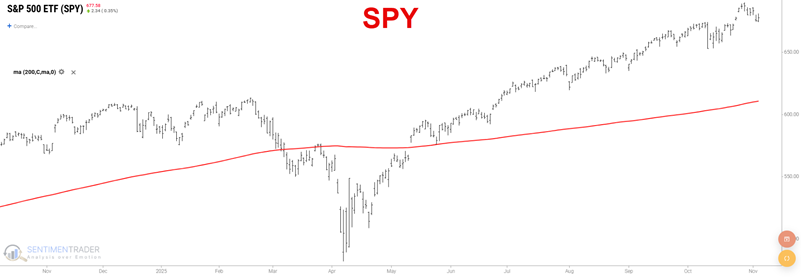
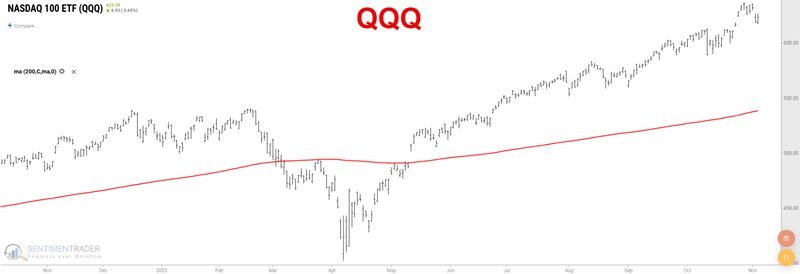
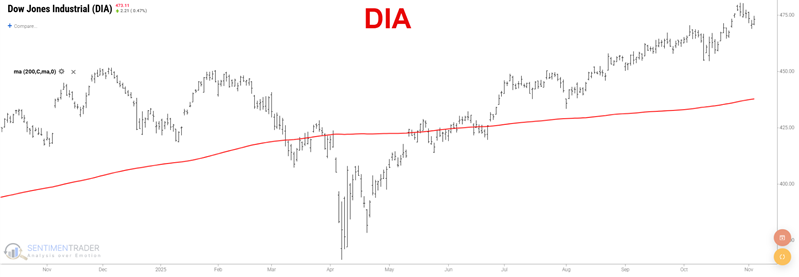
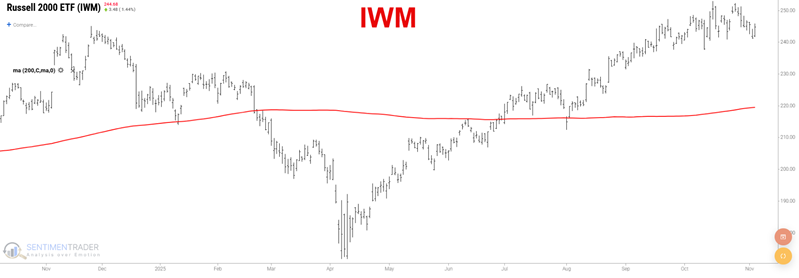
One danger in this scenario is that of becoming complacent and overly comfortable by simply riding a seemingly endless bullish trend. Another danger is that of overreacting to any sign of potential trouble. So, let's stipulate right here that the information detailed below does not presently qualify as "bearish", and there are no "Sell" signals blaring.
However, it is essential to watch for potential storm clouds as they form in the distance. A few that we see right now are detailed below.
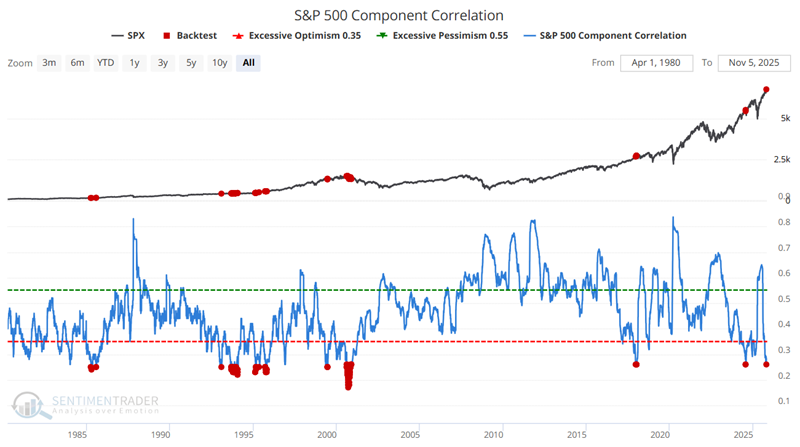
S&P 500 Component Correlation Plunges
This indicator shows the correlation among members of the S&P 500 index. During times of panic, investors tend to buy or sell "everything" together, regardless of their individual merits, resulting in increased correlation. The higher it goes, the more we're seeing groupthink, which tends to occur during times of extreme pessimism and is thus usually a positive for stocks in the future. When conditions are calm and investors become complacent, they trade stocks on their own merits, and correlation drops. This tends to result in below-average returns for the index going forward.
The chart below highlights all dates when the S&P 500 Component Correlation indicator was below 0.26. The most recent signal occurred on November 4th.
The table below summarizes S&P 500 performance following the dates highlighted in the chart above.
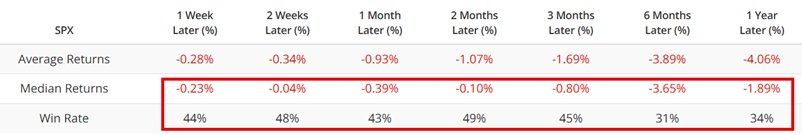
Note that for every timeframe, the Win Rate is below 50% and the Median Return is below zero. The median returns are not terribly negative, but given that the stock market has a long-term bias to rise, the values are well below average. Win Rates are also well below average, with six months (31% positive) being particularly troublesome.
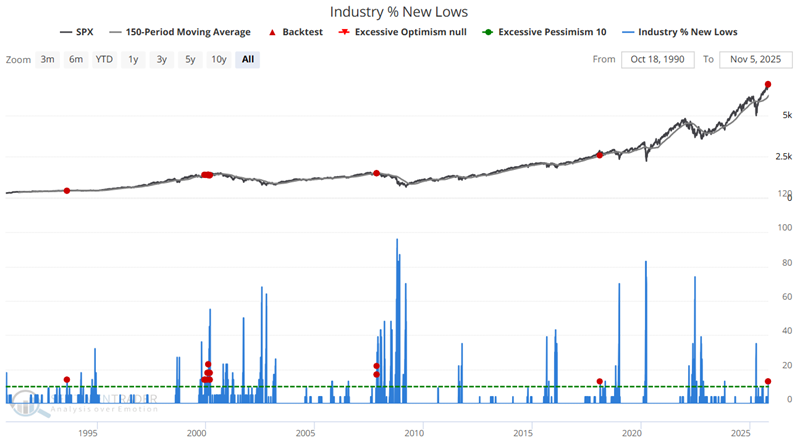
Industry New Lows have picked up
This indicator shows the percentage of 23 industries that have hit a 52-week low. The chart below highlights all dates when the indicator crossed above 10% while the S&P 500 is above its 150-day moving average. The most recent signal occurred on November 3rd.
The table below summarizes S&P 500 performance following the dates highlighted in the chart above.
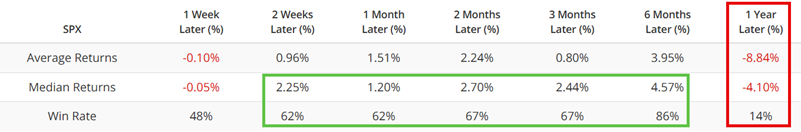
The Win Rates are respectable through six months, with six months showing a very robust 86% Win Rate. At the same time, the median returns over the first six months are fairly middling. Now look at the twelve-month results. The Median Return drops from 4.57% after six months to -4.10% after twelve months. Likewise, the Win Rate plunges from 86% after six months to just 14% after twelve months.
As I said at the outset, this is not a "Sell" signal, but it does serve as a warning sign.
The % of S&P 500 stocks making new lows has also risen
The SPY New Low % indicator shows the percentage of stocks in the S&P 500 index that are currently trading at a new 52-week low.
The chart below highlights all dates when the indicator crossed above 8% while the S&P 500 is above its 150-day moving average. The most recent signal occurred on October 29th.
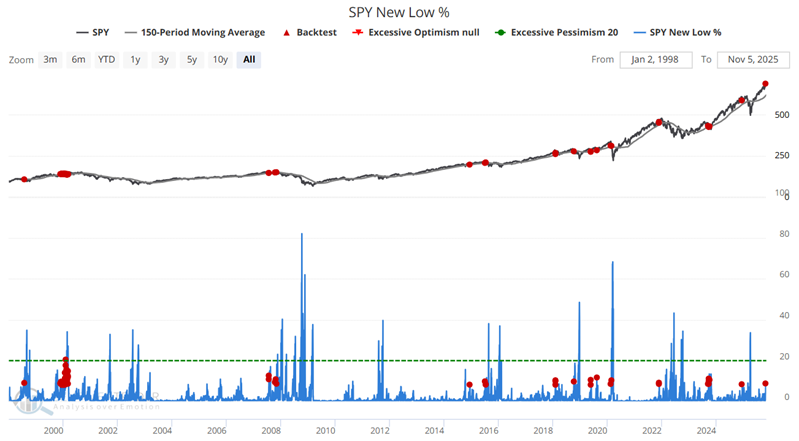
The table below summarizes S&P 500 performance following the dates highlighted in the chart above.
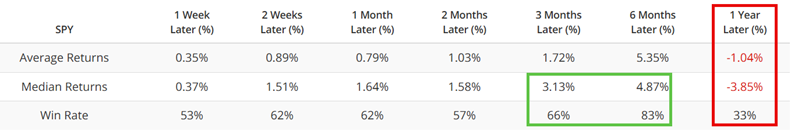
Once again, the Win Rates are respectable through six months, but the Win Rate plunges from 83% after six months to just 33% after twelve months. Likewise, the Median Return drops from +4.87% after six months to -3.85% after twelve months.
What the research tells us…
The signals above do not portend immediate disaster for the stock market. Most of them merely suggest the potential for subpar-and potentially negative-results for stocks over the course of the coming year. It is worth noting that, overall, the indicators and models I personally follow remain favorable for stocks. So the information above should not be interpreted as an automatic "I better sell all my stocks" signal. They merely remind us that "Trees don't grow to the sky" and that corrections are part of the usual ebb and flow of the stock market. The primary message is that a) Investors should by no means panic because some "clouds" have appeared on the market horizon, and b) investors should also not become complacent and assume that sharply higher new highs are guaranteed.