
Some Useful Indicators Signal Oversold Conditions

Key points
- After a six month advance, the stock market is trying to decide "which way from here?"
- While some breadth indicators are suggesting caution (see here and here), a variety of continuation-type indicators are suggesting that the market is oversold and due for a bounce
- These include our Major Sector Breadth (% > 50 Day Avg), Risk On/Risk Off, and Fear & Greed Models detailed below
Major Sector Breadth hits oversold
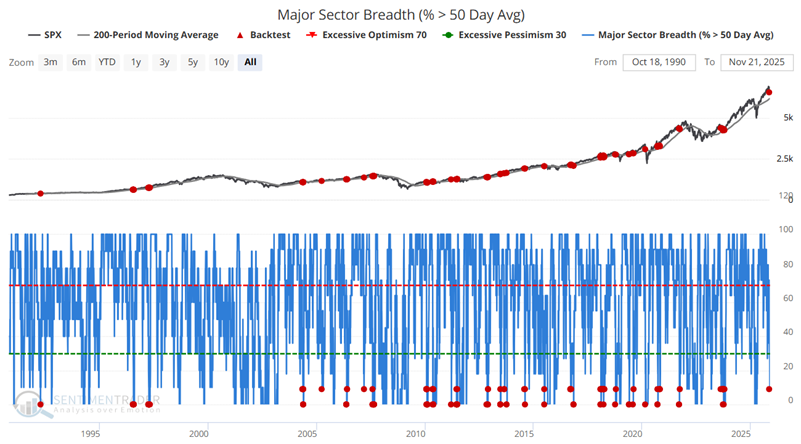
Our Major Sector Breadth (% > 50 Day Avg) indicator shows the percentage of 11 major sectors that are trading above their 50 Day moving averages. It includes technology, energy, financials, health care, utilities, consumer discretionary, consumer staples, industrials, communications, materials, and real estate.
The chart below highlights all dates when the S&P 500 Index was above its 200-day moving average and the Major Sector Breadth (% > 50 Day Avg) indicator was below 10.
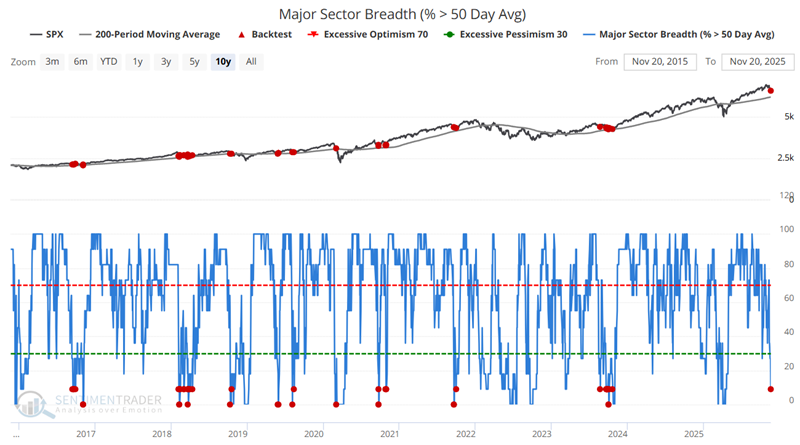
The chart below zooms in on the last ten years of action for a closer view of the action. As you can see, this is not a signal that happens often.
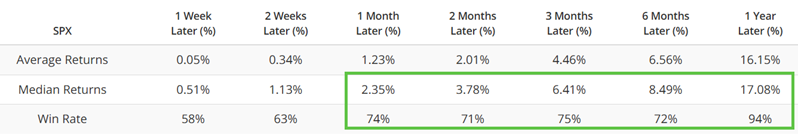
The table below summarizes subsequent S&P 500 Index action following the signal dates highlighted in the chart above. All time frames from 2 weeks to 1 year have solid Median Returns and Win Rates ranging from 75% to 91%.
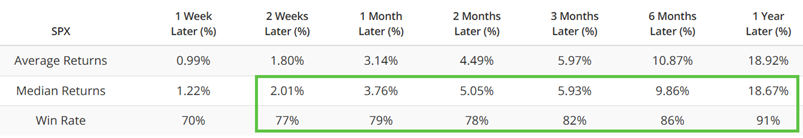
The recent signal on November 20th falls firmly on the favorable side of the weight of the evidence ledger. Let's look at some other indicators that have flirted with oversold levels.
Risk On/Risk Off meets countertrend thinking
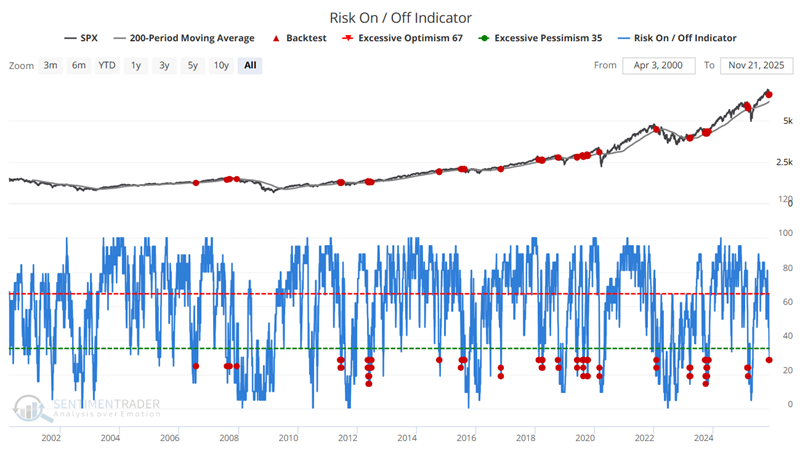
Our Risk On/Risk Off indicator examines the indicators listed on our Risk On/Risk Off Overview page and calculates the percentage of indicators that are considered "risk on." In its standard application, this indicator serves as a trend-following indicator. In that capacity, it is considered risk-on when it crosses above 67 and remains in that condition until it falls below 35. It is risk-off when it crosses below 35 and stays in that condition until it crosses above 67.
However, like many indicators, this one can be applied in various ways. Many indicators that serve as trend-following measures can occasionally reach extreme readings in either direction. When that happens, some investors may choose to view it as a countertrend "overbought/oversold" type indicator. Let's consider one such application with our Risk On/Risk Off indicator.
The indicator crossed above 67 on June 2nd of this year, with the S&P 500 at 5,836. It crossed back below 35 on November 17, with the S&P 500 14.3% higher. Thus, if applied strictly on a trend-following basis, it will remain unfavorable until it rises back above 67. However, let's examine a potential counter-trend application. The chart below highlights all dates when the Risk On/Risk Off indicator was below 30 while the S&P 500 was above its 200-day moving average.
The table below summarizes subsequent S&P 500 performance following the dates highlighted in the chart above.
The danger with using this setup as a standalone trading signal is that it can sometimes be early. Nevertheless, this setup typically does a good job of alerting us to the fact that an oversold situation is forming.
Fear & Greed is getting a lot of attention
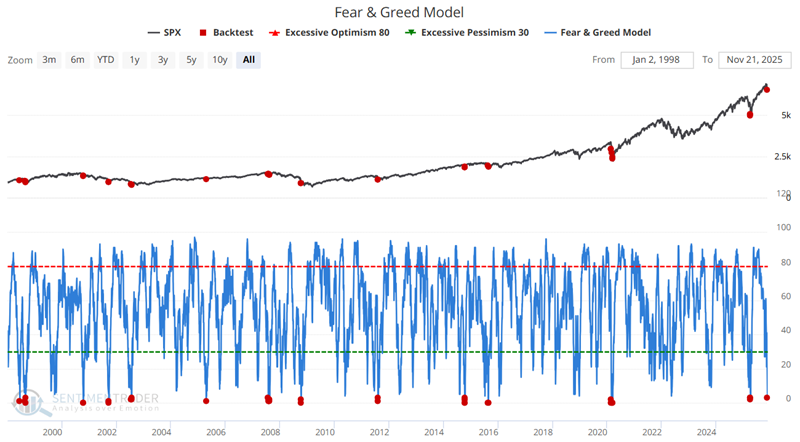
The Fear & Greed Model has recently plunged, garnering significant investor attention along the way. Note that we use our own version of the model published by CNN on their public website. This is our calculation of the model based on the inputs discussed on their website. It does not reflect the values published by CNN; rather, it is our interpretation of the model. We use different inputs for the put/call ratio to more accurately reflect trading activity, and a different junk bond input to avoid some issues with using an ETF-based value. The model measures inputs such as price trend, volatility, options trading, and bond trading to determine prevailing investor sentiment. It should be interpreted similarly to other sentiment indicators and models, with rising optimism being beneficial for stocks until it reaches an extreme level, at which point it becomes a contrary indicator, as it becomes increasingly optimistic. The inverse is also true, with declining optimism being a negative for stocks until it reaches an extreme, at which point it begins to act as a contrary positive indicator.
The chart below highlights all dates when our version of the Fear & Greed Model was at three or lower (on a scale of 0 to 100).
The table below summarizes subsequent S&P 500 Index action following the signal dates highlighted in the chart above.
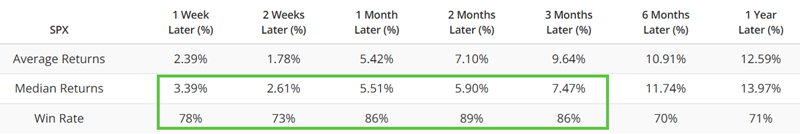
The most favorable performance tends to occur in the one to three-month period following a signal, with Win Rates in the high eighties.
What the research tells us…
Each of the indicators above are designed to measure strength - or a lack thereof - in the stock market. However, in the face of an overall rising trend for the major stock market indexes, weakness in these indicators can highlight an oversold condition, which often equates to a buying opportunity in a pullback. Taken individually, the indicator signals shown above have demonstrated decent reliability (75% to 90%+ Win Rates and above average Median Returns). However, the reality is that there are no guarantees that an oversold signal from any indicator will see an immediate and/or meaningful bounce in stock prices. Likewise, an oversold market can always become more oversold. And sometimes, the market will simply roll over and plunge into a bear market.
For now, the accumulation of the signals highlighted above suggests - but in no way guarantees - the potential for a meaningful bounce back for stocks in the months ahead.