
Some signs of a pullback in an ongoing uptrend

Key points
- For now, the S&P 500 Index remains in an uptrend above its 200-day moving average
- At the same time, a variety of indicators are flashing oversold signals
- From a weight of the evidence perspective, this has the earmarks of a buying opportunity
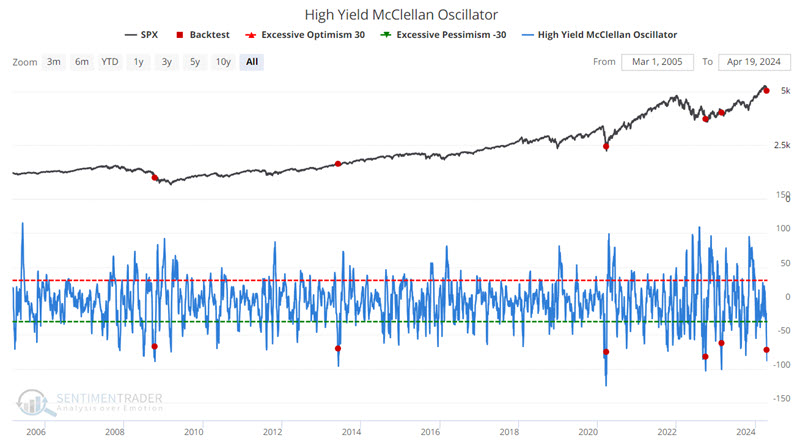
High Yield McClellan Oscillator versus the broader stock market
The chart below highlights those dates when the High Yield McClellan Oscillator crossed above -88 (thus indicating a reversal from a deeply oversold condition). The latest signal occurred on 2024-04-17.
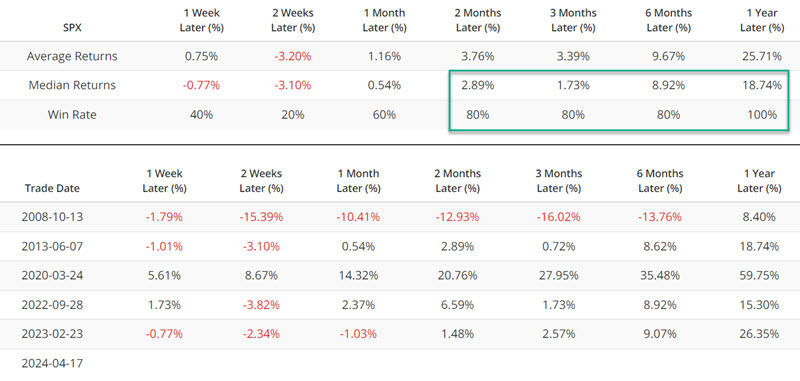
The table below displays S&P 500 performance results.
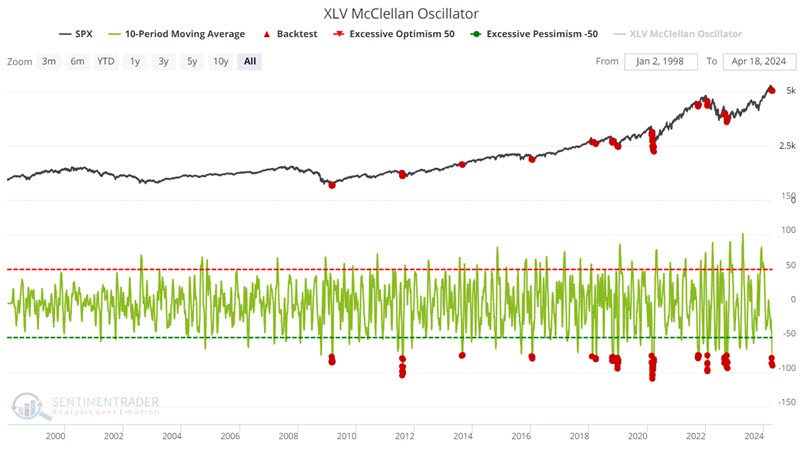
The XLV McClellan Oscillator plunges
The chart below highlights those dates when the 10-day average of the XLV McClellan Oscillator crossed below -75. The latest signal occurred on 2024-04-18.
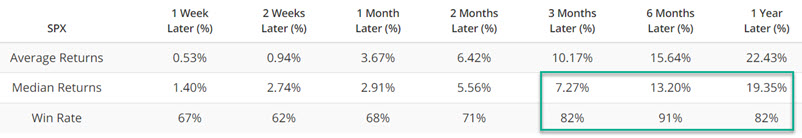
The table below displays S&P 500 performance results.
The Equity Put/Call Ratio with another spike
The chart below highlights those dates when the Equity Put/Call Ratio crosses above 1.00 while the S&P 500 is above its 200-day moving average. The latest signal occurred on 2024-04-17.
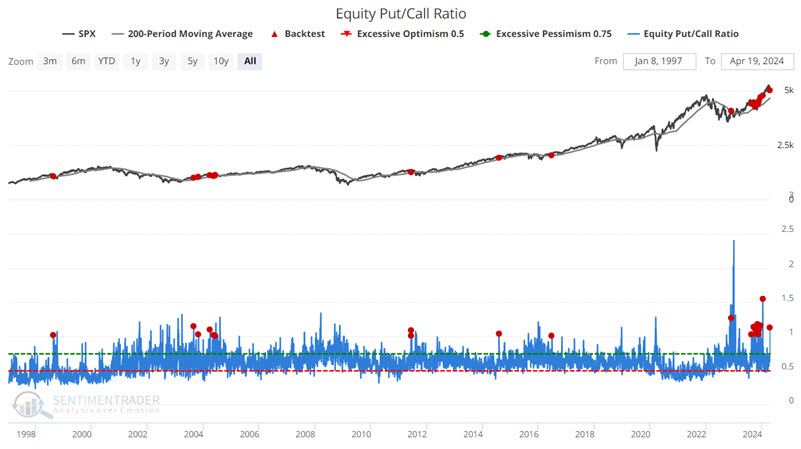
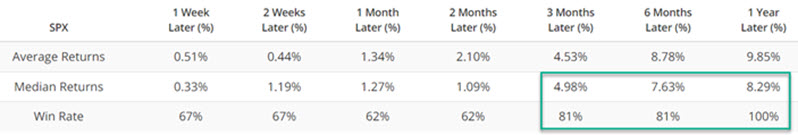
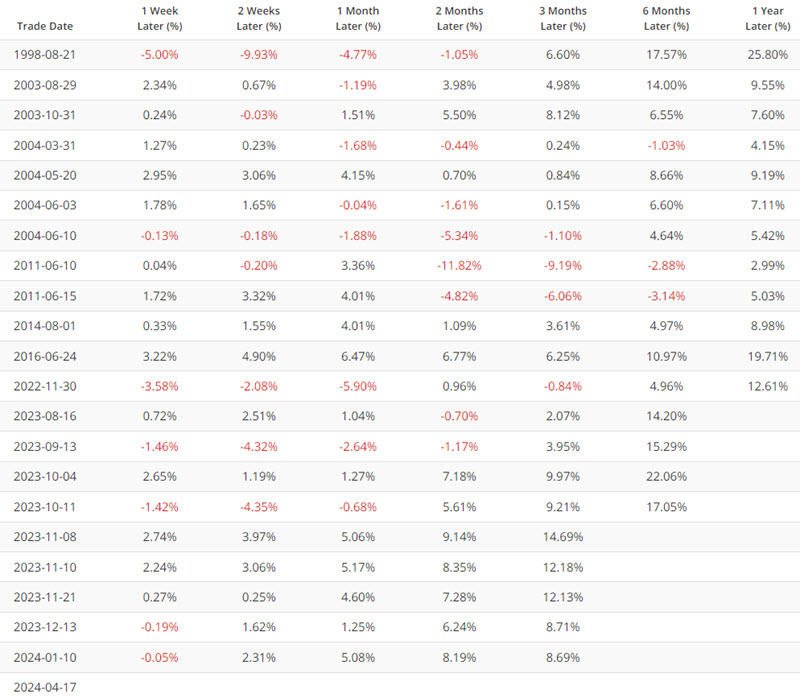
The tables below display S&P 500 performance results.
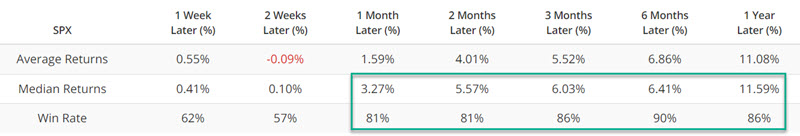
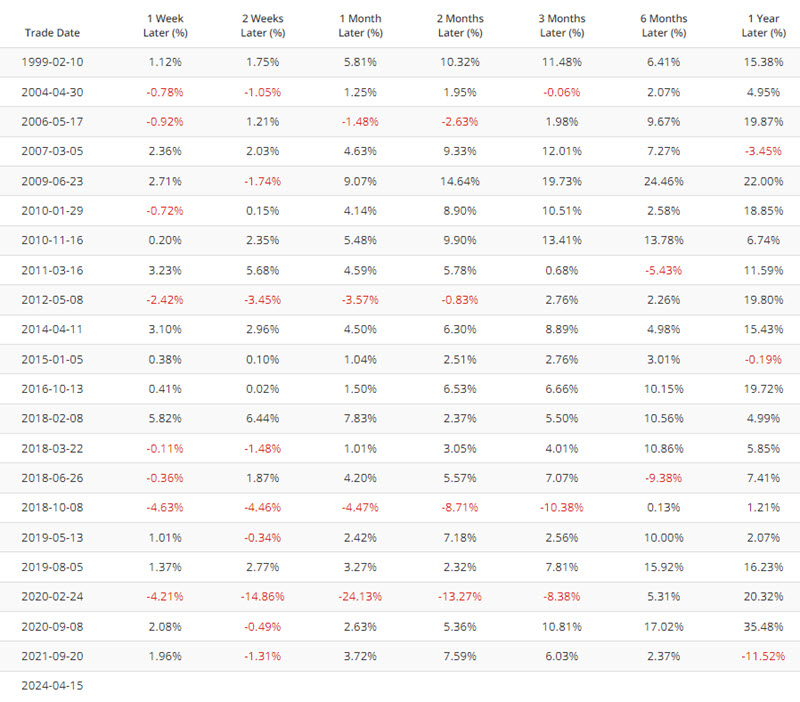
The XLK Breath (% > 10 Day Avg) indicator hits oversold
The chart below highlights those dates when the XLK Breath (% > 10 Day Avg) indicator crossed below three while the S&P 500 Index was above its 200-day moving average. The latest signal occurred on 2024-04-15.
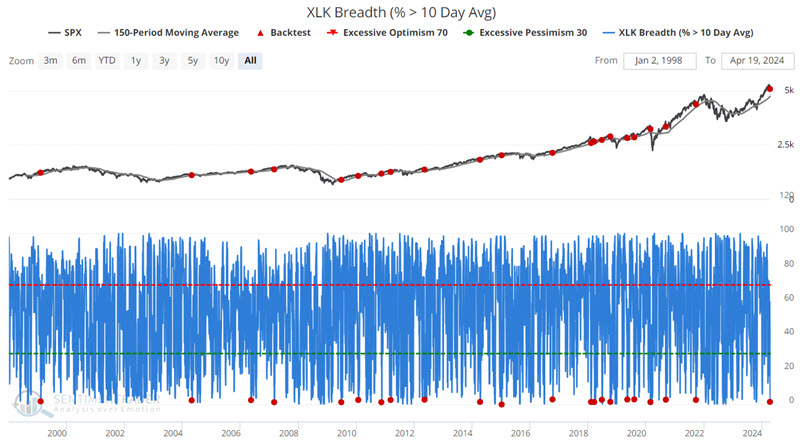
The tables below display S&P 500 performance results.
What the research tells us…
None of the recent signals highlighted above guarantees a resumption of a broader stock market advance soon - or at all, for that matter. However, when considered together, there is a clear pattern in place. The broader market is still in an uptrend, and various market segments (high yield, healthcare, and technology) are experiencing pullbacks. From a weight of the evidence approach, this is a textbook scenario of a standard market pullback (and ultimately a buying opportunity - although timing an exact bottom is a nebulous goal). That said, how quickly things might actually turn around (if at all) and how far a rebound might run is never guaranteed.