
Some short-term headwinds for a gold bull market

Key points
- Gold has burst higher to new all-time highs in 2024
- There remain several important favorable trend-following signs
- However, for the first time in the recent advance, several shorter-term warning signs have appeared
Gold has soared, but the long-term trend remains favorable
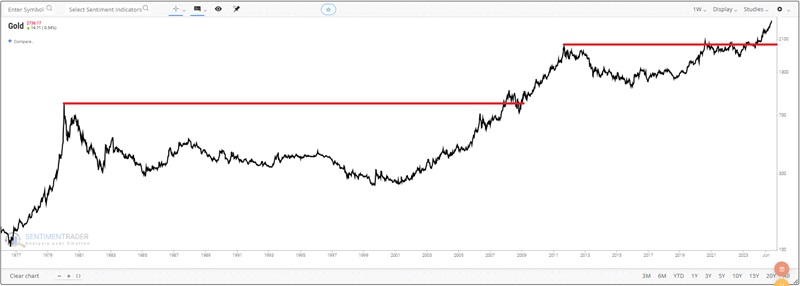
Gold has enjoyed a terrific rally. The yellow metal has soared to new all-time highs and advanced roughly 50% in just over a year.
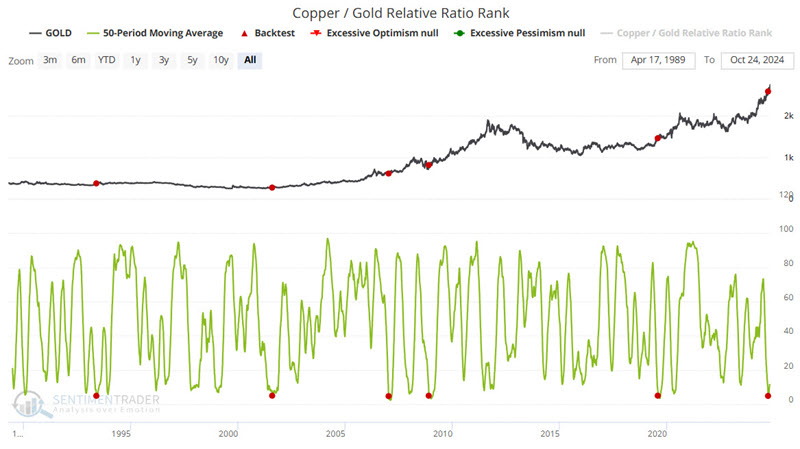
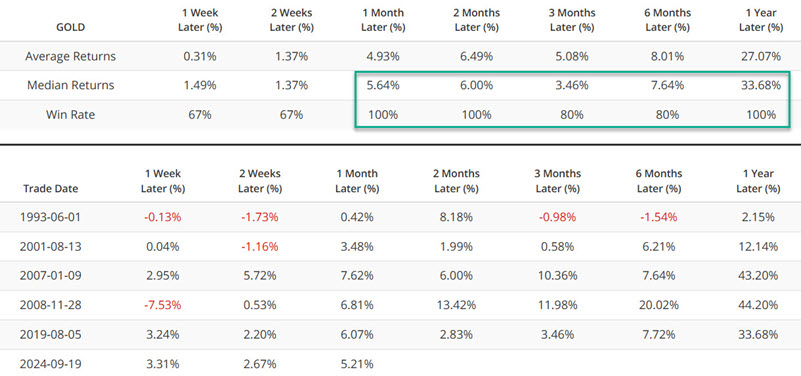
Overall, the trend for gold remains favorable, and on a trend-following basis, there is little reason for concern. The chart and table below are from an article published on 2024-09-24, which highlights gold's historical performance based on the action of the Copper/Gold Relative Ratio indicator. The most recent signal on 2024-09-19 suggests the potential for continued bullish action in the year ahead.
Another reason for continued optimism over the next year was found in this article published by Dean Christians' ModelEdge report dated 2024-10-22. The simple trend-following method Dean detailed has a terrific bullish track record.
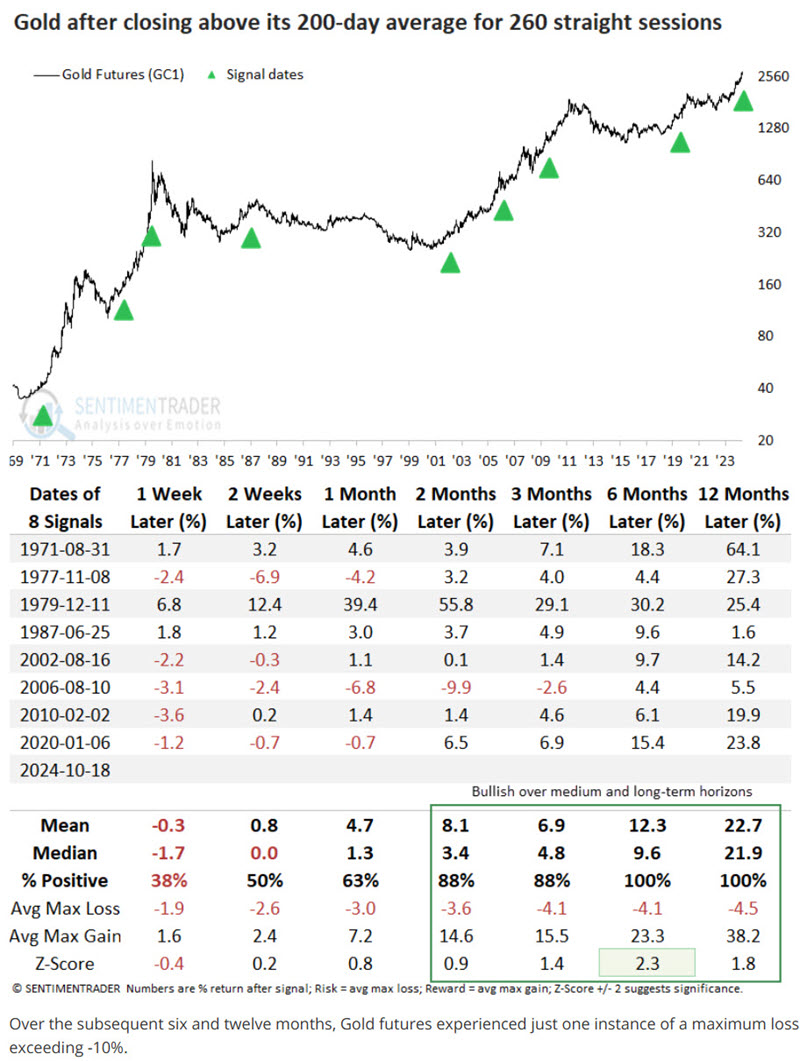
See the linked article for details.
But some intermediate-term warning signs are emerging
It comes as no surprise that gold traders are becoming more bullish as gold rockets higher. Up until recently, sentiment remained in the "normal" range. But a longer-term view of our Gold Optix indicator finally flashed an overly bullish warning sign recently.
The chart below highlights those dates when the 200-day moving average of our Gold Optix indicator crossed above 69%. The most recent signal occurred on 2024-10-24.
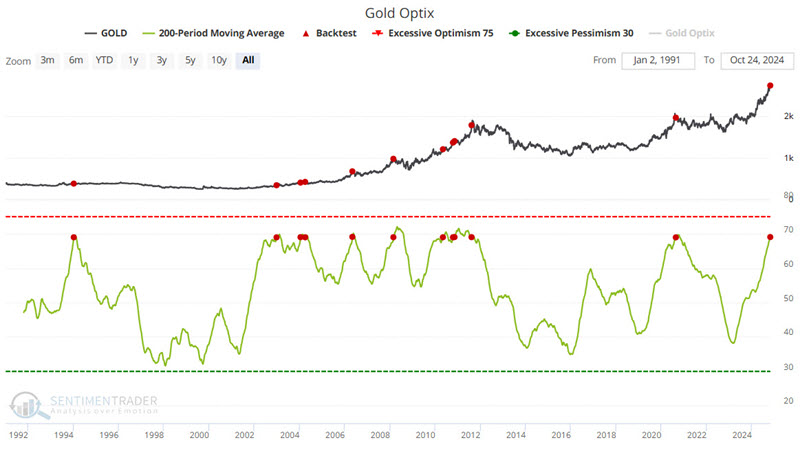
The table below summarizes subsequent gold performance.
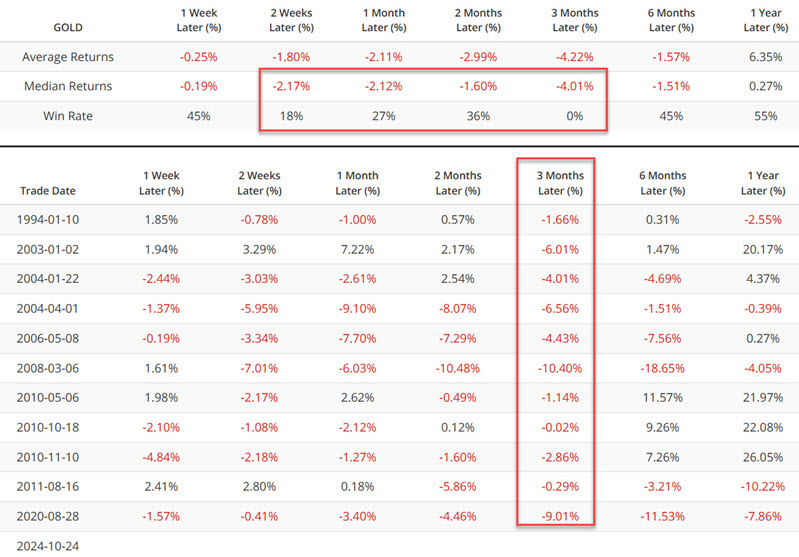
With commodity markets, it is very possible for something to go on a vertical tear and leave any and all worries in the dust (see Cocoa from October 2023 into April 2024). The potential for gold to "go parabolic" as it did in the late 1970s and early 1980s is real. That said, if one were inclined to "play defense" or even go the other way, the indicator iteration above suggests that now would be the time to look for that opportunity.
Correlation Match also flashes a yellow light
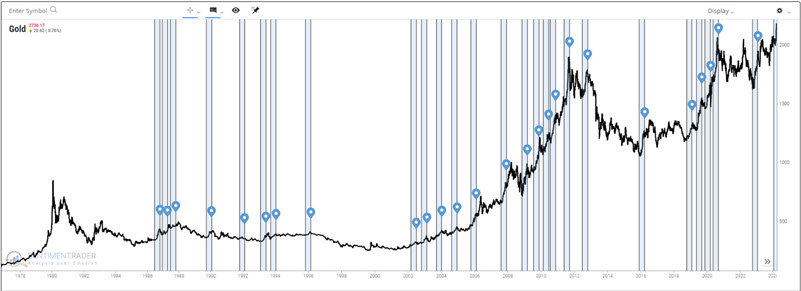
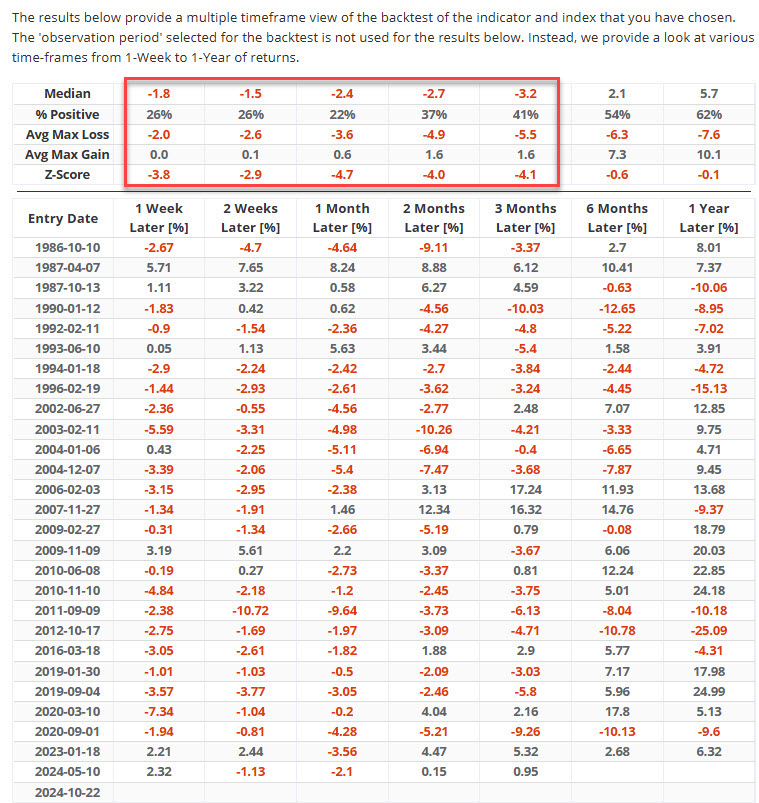
Our Correlation Pattern Match Tool is a new Basktest 2.0 tool. In the test below, we asked the tool to look at the 2024-06-26 to 2024-10-22 period and find periods in the past that showed a correlation of 95% or higher. The goal is to see how gold performed following such periods in the past. The results were pretty stark.
The chart below highlights all of the periods found that had a 95%+ correlation.
The table below displays gold's performance during the 21 days after the end of the periods highlighted in the chart above. We find an abysmal 17.86% Win Rate, a Median Return of -2.51%, and an Average Return of -5.42%.
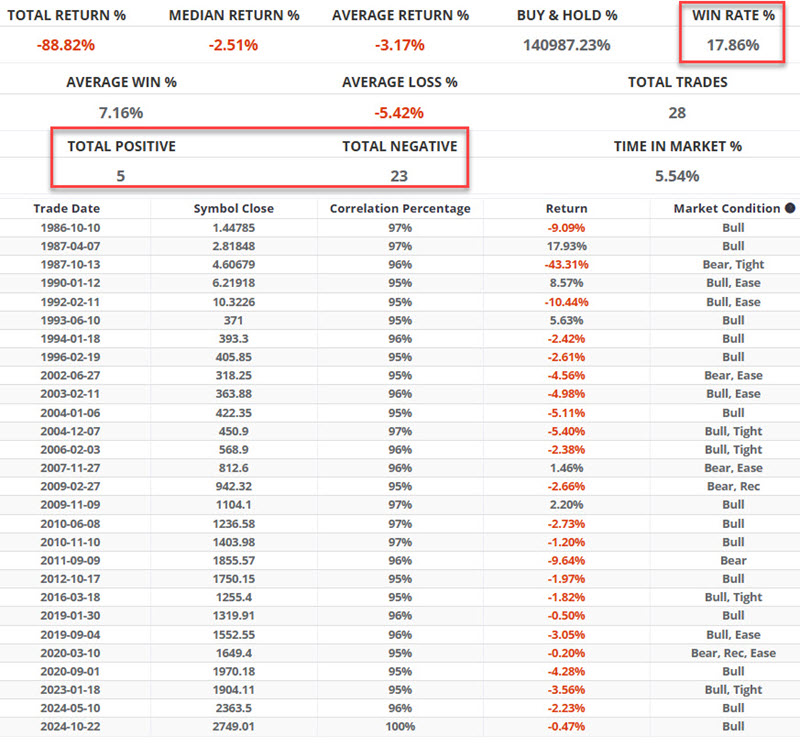
The table below expands the testing results to our more typical 1-month to 1-year analysis. Through three months after a period end date, gold's performance has been pretty dreadful. Most notably, 1-month showed a Win Rate of 22%, a Median Return of -2.4%, and a Z-Score of -4.7.
What the research tells us…
Talk about "mixed signals." From a trend-following perspective, you can't ask for much more from gold. A powerful uptrend with confirmation from two reliable indicators can give a long-term investor the confidence to "keep riding." As we saw just above, however, there is a high potential for at least a meaningful correction in the weeks or months ahead.