
Some sentiment warning signs to ring in the New Year

Key points
- Trend-following and momentum indicators suggest that stocks, bonds, and gold are all presently in uptrends
- Still, one key to investment success is asking yourself, "What am I missing, if anything?"
- While not enough to trigger a "sell everything" signal, some sentiment warning signs have appeared recently and are worthy of note
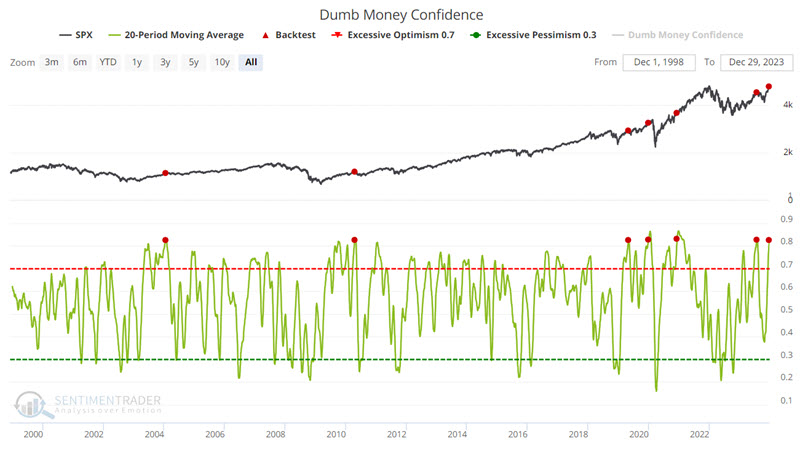
Dumb Money Confidence is getting quite frothy
The historical action of Dumb Money suggests that they are often wrong at the extremes. As the market declines, they become more gloomy, and as the market rallies, they becomes more euphoric. This often results in their being taken by surprise when the market turns.
The measure highlighted here was pointed out to me on Twitter by an alert ST subscriber who goes by CostanzaTrader (@MarketObserver8). The chart below highlights those dates when the 20-day moving average for Dumb Money Confidence crossed above 0.82. The most recent signal occurred on 2023-12-28.
The sample size is small, so we must consider the latest signal as more of an "alert" and less of an actionable "sell short" signal. The table below summarizes subsequent SPX performance and the signal-by-signal results.
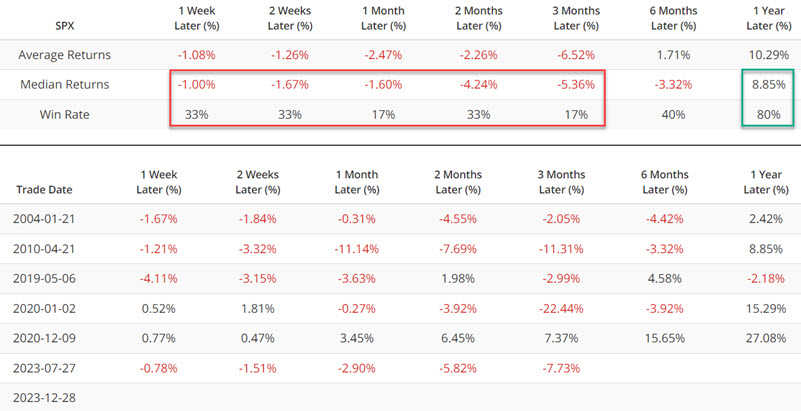
Two key things to note: 1-month and 3-month returns show a Win Rate of just 17%. This suggests the potential for the market to consolidate recent gains in the months ahead. The other key thing to note is the tendency for the market to rally from 3 months to 12 months after a signal. One way to view the latest results is as a warning for short-term traders and a sign that long-term term investors should continue to give the bullish case the benefit of the doubt.
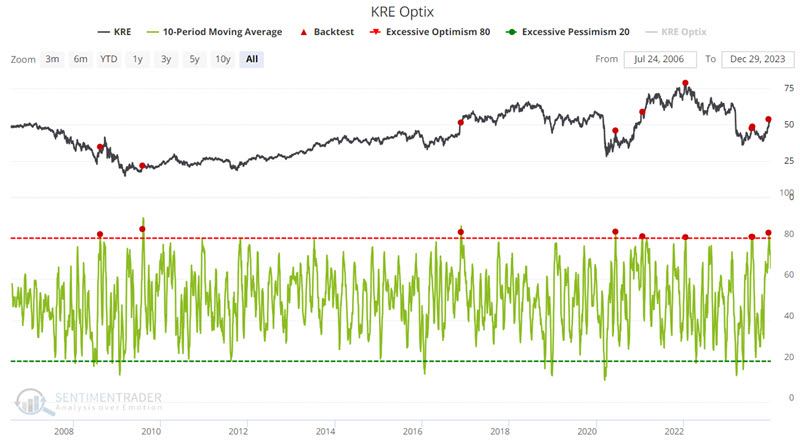
Bank stock investors may be getting ahead of themselves
Bank stocks tend to move in bursts. As such, they offer the potential for fast gains and sharp losses. Bank stock trader sentiment also tends to swoop and soar as prices move. The chart below highlights all dates when the 10-day moving average for the SPDR S&P Regional Banking ETF (ticker KRE) Optix crossed above 80%.
The table below summarizes subsequent KRE performance and the signal-by-signal results.
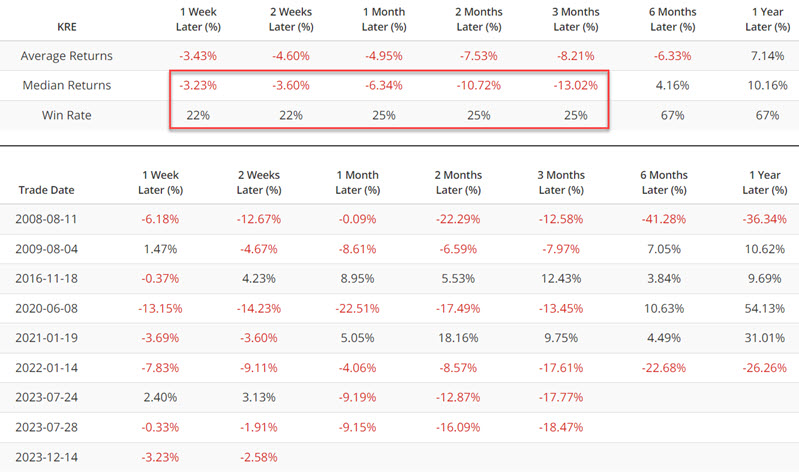
The critical warning from the information above is the 25% or lower Win Rate for time frames through 2 months and the double-digit median decline for 1-month and 2-month periods.
The most recent signal occurred on 2023-12-14. Since the 2023-12-14 signal, KRE is down -2.5%. The results suggest that investors look elsewhere for a buying opportunity, at least into mid-March 2024.
Bond bounce brings back the bond bulls
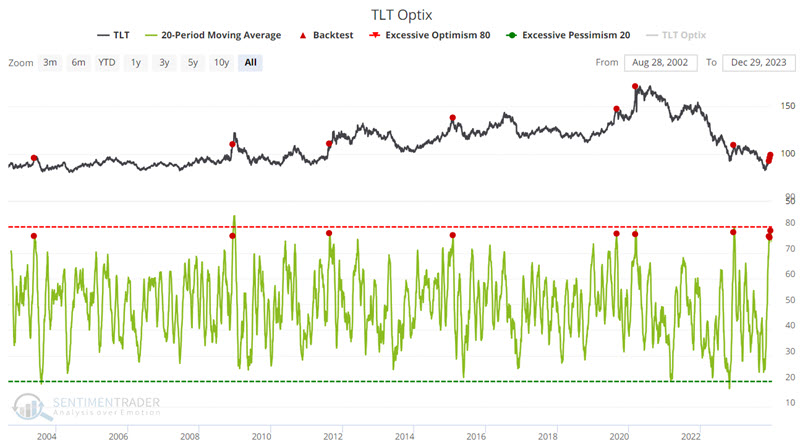
The iShares 20 Plus Year Treasury Bond ETF (ticker TLT) staged a powerful +20%+ rally from its October 2023 low. If TLT were to retrace 50% of its full 2020-2023 bear market, the shares could rise another 30%. Will that happen anytime soon? We can't predict. One thing we can do is note that bond bulls have come back with a vengeance.
The chart below highlights all dates when the 20-day moving average for the TLT crossed above 76%.
The table below summarizes subsequent TLT performance and the signal-by-signal results.
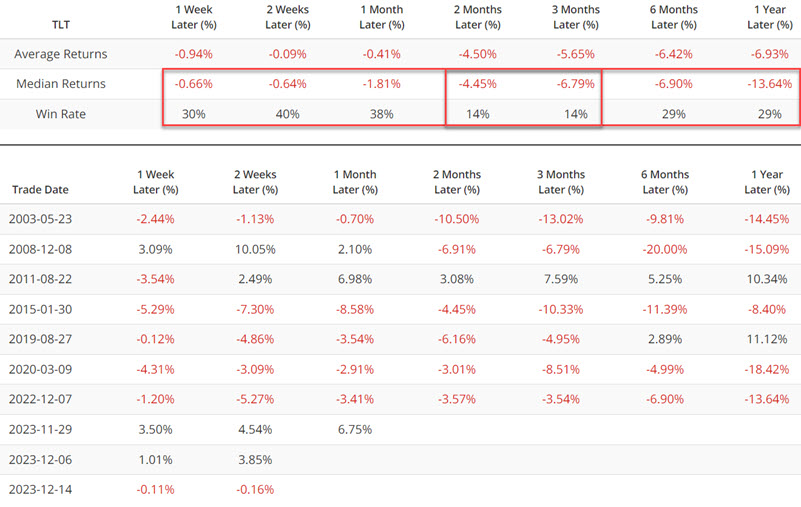
TLT has been essentially unchanged since the most recent 2023-12-14 signal. Still, the historical results suggest the potential for bond weakness in the weeks and months ahead.
Gold stocks seeing a spike in bullishness
There has never been a rally in gold since the late 1970s/early 1980s when there weren't some pundits loudly pounding the table about the next big gold rally. And when gold rallies, gold stocks hold the potential for substantial gains. There may not be a more volatile and historically underperforming sector than gold stocks. So, when gold stock bullishness spikes, it is typically worth noting - although the spikes often occur early.
The VanEck Gold Miners ETF (ticker GDX) rallied over +27% off its early October 2023 low before pulling back in the most recent week.
The chart below highlights all dates when:
- The 50-day moving average for GDX Optix was above 60%
- And GDX was above its 150-day moving average
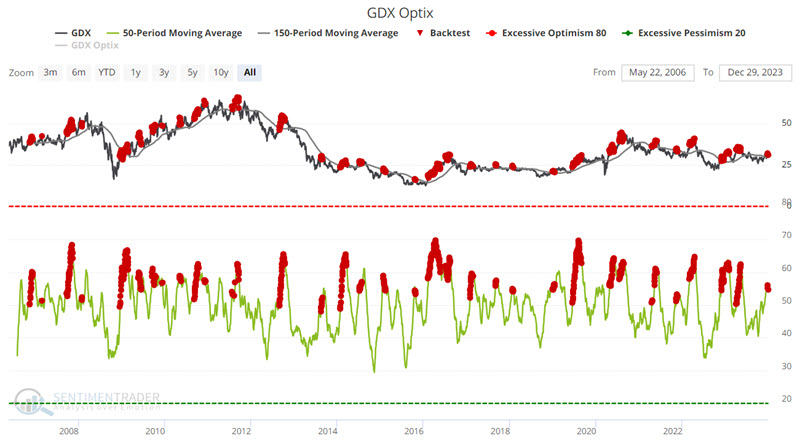
The good news is that most tops in GDX occurred when this configuration existed. However, the first instance of this configuration often occurred well before an actual increase in price. In other words, selling short at the first occurrence typically was not an ideal play. Timing a bearish play based on this alert is left to each trader.
The table below summarizes GDX performance following all signals.
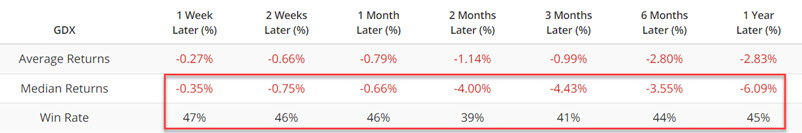
Each time frame shows negative Average and Median results and a Win Rate of less than 50%. This suggests that this signal provides a valid warning and should not be ignored. At the same time, another more precise (possibly price-based) indicator should likely be used by a trader looking to play the short side of gold stocks.
What the research tells us…
One mistake many individuals make is assuming that an uptick in bullish sentiment constitutes an automatic sell and/or sell short signal. A spike in bullish sentiment often serves as a "shot across the bow" to alert us that a recent price advance may be getting overdone. The information above suggests that the "one-way street" nature of recent advances in stocks, bonds, and gold may not persist and that investors may need to brace themselves for more two-way volatility in the short term.