
Some potential signs of life in the health care sector

Key points
- The healthcare sector has been in a holding pattern for almost two years
- A variety of indicators suggest better days might be ahead
- These include signals from seasonal, insider, and breadth indicators
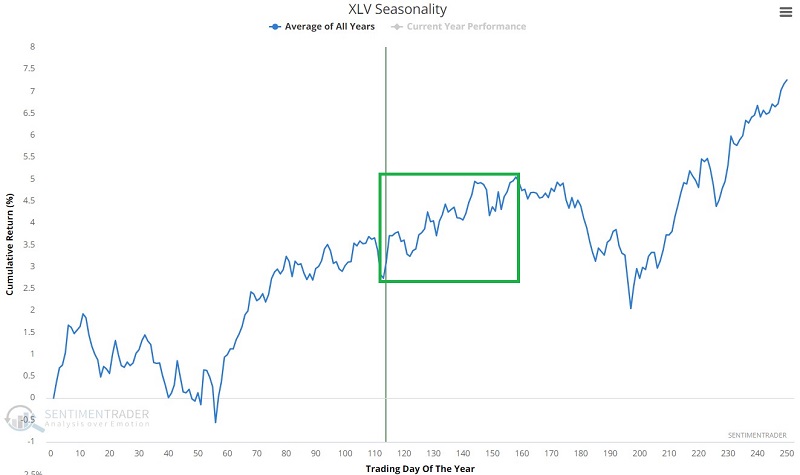
The annual seasonal trend for XLV
The chart below displays the annual seasonal trend for the Health Care Select Sector SPDR Fund (ticker XLV). The sector is in a favorable seasonal period extending from the close of Trading Day of the Year (TDY) #113 through TDY #158. For 2023, this period extends from the close on 2023-06-14 through 2023-08-22.
For the chart below, we use sector index data starting in 1953. The data series tracks the Fama French Health Care sector index from 1953 to 1991 and the S&P 500 Health Care sector index (which is the index that XLV tracks) from there. The chart below displays the growth of $1 if held in the healthcare sector only from the close of TDY #113 through TDY #158 each year since 1953. The table below summarizes sector performance during this annual period.
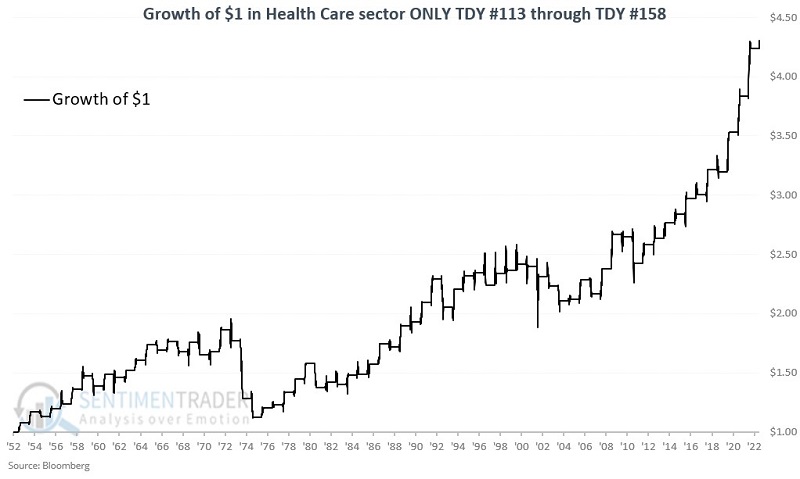
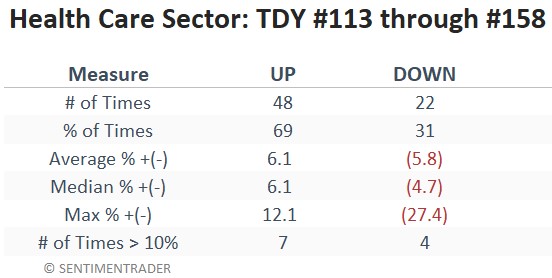
Higher prices for healthcare stocks during this period are obviously no sure thing (up roughly seven years of every 10). But let's consider a few other indicators that bolster the bullish case.
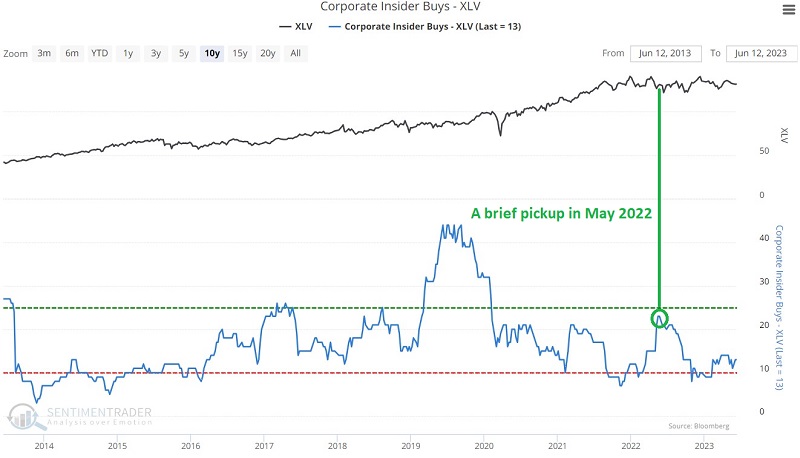
Healthcare insiders appear to be sending a message
The most bullish thing insiders can do is buy shares of their own company. There was a brief spike in buying activity in May 2022 after a decline in healthcare stock prices. However, objectively speaking, healthcare insiders are hardly "loading up," as shown in the chart below.
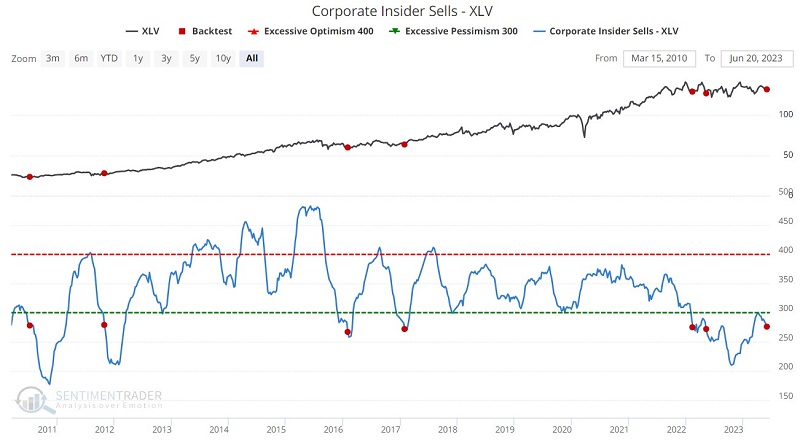
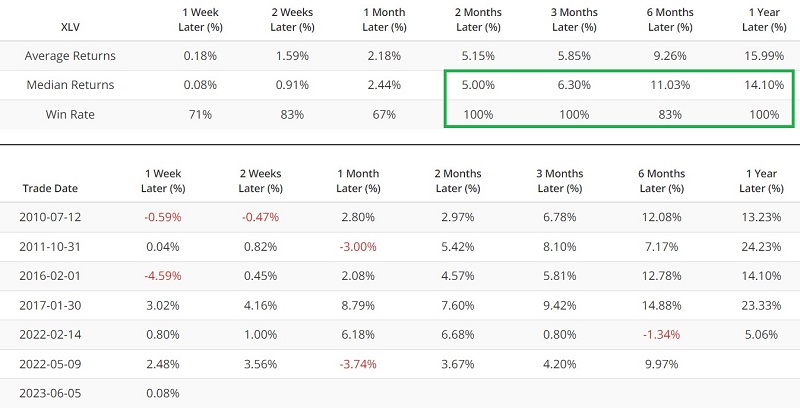
The second most bullish thing insiders can do is not to sell shares of their own company. The chart below shows that our Corporate Insider Sells - XLV indicator recently crossed below 280. The table displays all previous instances. Historically, sector performance has been favorable when healthcare insiders reduce their sales.
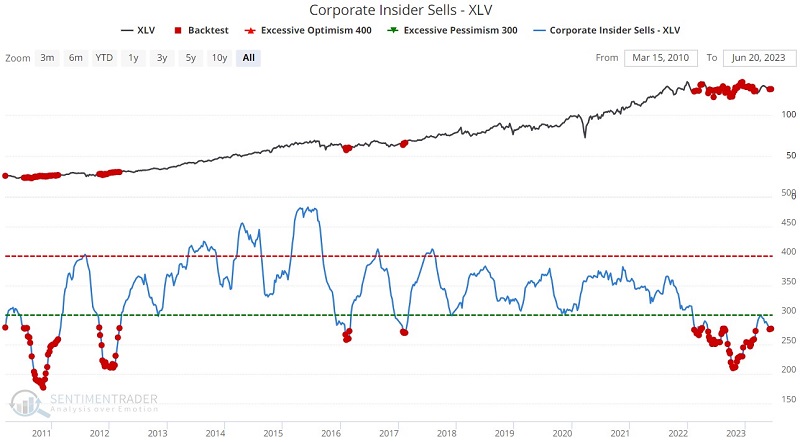
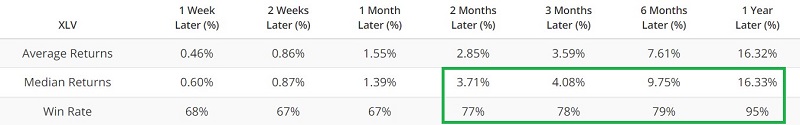
If we loosen the restriction of dropping through 280 and consider all weeks when the indicator stood below 280, we get the results in the chart and table below. Clearly, healthcare sector insiders have been very patient as share prices have stagnated.
It would add much weight to the bullish side of the ledger if healthcare insiders started buying heavily. Nevertheless, the fact that they have reduced their sales significantly, even in the face of lackluster performance for almost two full years, does appear to send a hopeful message.
A recent breadth signal adds some bullish weight
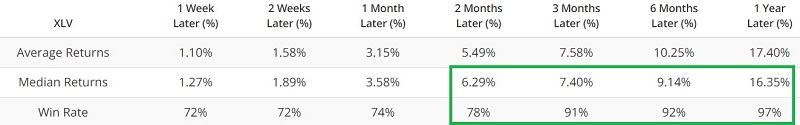
The chart and table below highlight all days when the XLV McClellan Oscillator indicator was below -100. The most recent signals occurred near the end of May 2023 and mid-March. Both signals marked interim bottoms for XLV.
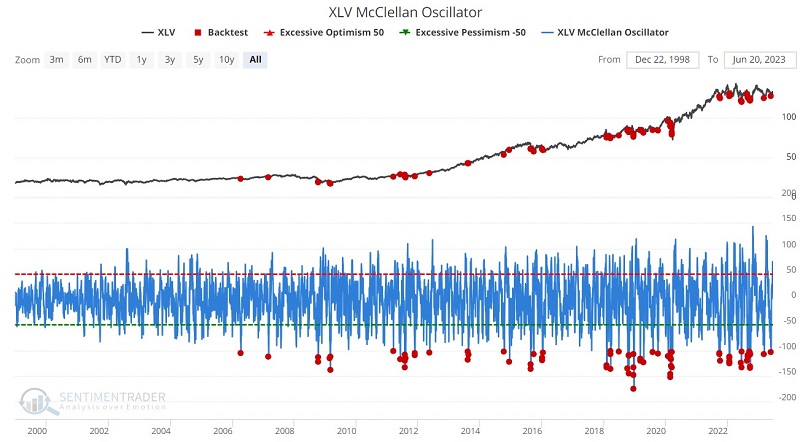
As with any indicator, no individual signal is guaranteed to be followed by higher prices. That said, when combined with the other highlighted indicators, the recent signals from this indicator appear to add weight to the bullish case for health care.
A word on technical analysis
I am a big fan and user of technical analysis. At the same time, I consider much technical analysis to be subjective. So consider the following comments to be entirely subjective in nature. Their inclusion in this piece is for risk management purposes only.
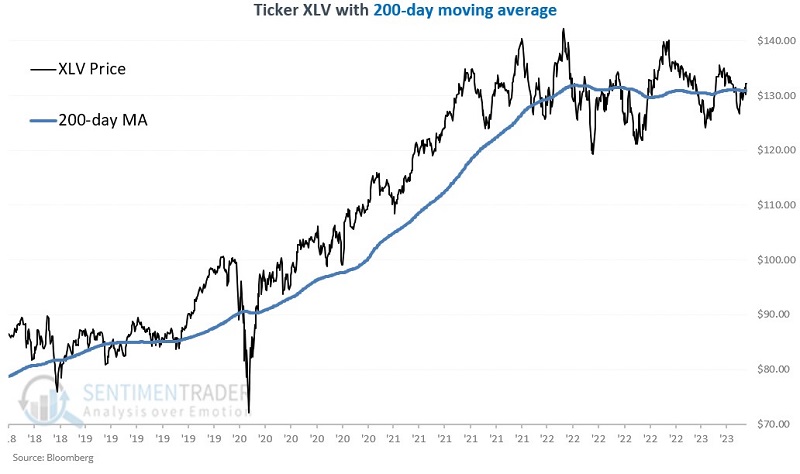
For now, XLV needs to stabilize above its 200-day moving average. As long as that holds, investors might give the bullish case the benefit of the doubt. From a "stage analysis" perspective, the move from 2018 to 2021 could be labeled Stage 2 (the bullish stage). The sideways period since 2021 could be marked as Stage 3 (distribution). Classic stage analysis suggests that the next stage - Stage 4 (the bearish stage) - would see a significant bear market decline, with price breaking below the 200-day average, the 200-day average turning lower and descending as bearish confirmation. The bottom line: If the price action does not confirm the indicators above, caution is advised.
What the research tells us…
There is no guarantee that the healthcare sector will bounce back in the months ahead. However, the spate of favorable signals we have witnessed recently suggests that after stagnating for two years, the healthcare sector may finally be poised for better results. As long as XLV price action remains constructive, investors and traders might give the bullish case the benefit of the doubt. Another drop below the long-term average would suggest potentially more of the same as we've seen in the last two years and suggest caution.