Products
SentimenTrader Trading Tools
‍
Backtest Engine
My Trading Toolkit
Correlation Analysis
Seasonality
Market Prediction
Indicators & Data API
‍
Proprietary Indicators & Charts
Market Data API
Strategies & Scanner
‍
50+ Trading Strategies
Smart Stock Scanner
Smart Option Scanner
Research Reports
‍
Research Solutions
Reports Library
Free Resources
Simple Backtest Calculator
Simple Seasonality Calculator
The Kelly Criterion Calculator
Sentiment Geo Map
Public Research Reports
Education
Sentiment Indicators
Technical Indicators
Pricing
Company
About
In the News
Testimonials
Client Success Stories
Contact
Log inLoginSign up
< BACK TO ALL REPORTS

Some interesting reversals with bullish implications for stocks

Dean Christians
2022-10-27
The percentage of sub-industry groups up > 5% over ten sessions has exploded higher, triggering a signal with bullish implications for stocks. With stocks recovering, volatility has eased, which suggests the counter-trend rally can continue.

Key points:

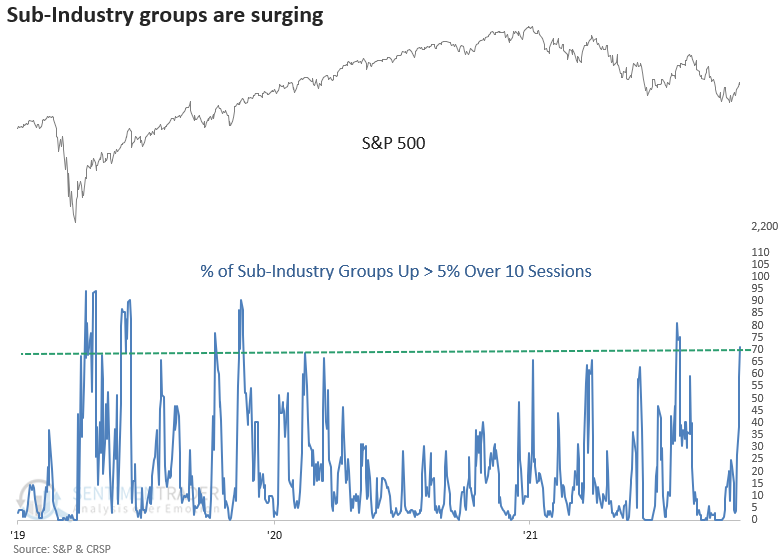
  • The % of Sub-Industry groups up > 5% over 10 sessions cycled from < 3% to > 70%
  • The surge in participation occurred in only five sessions
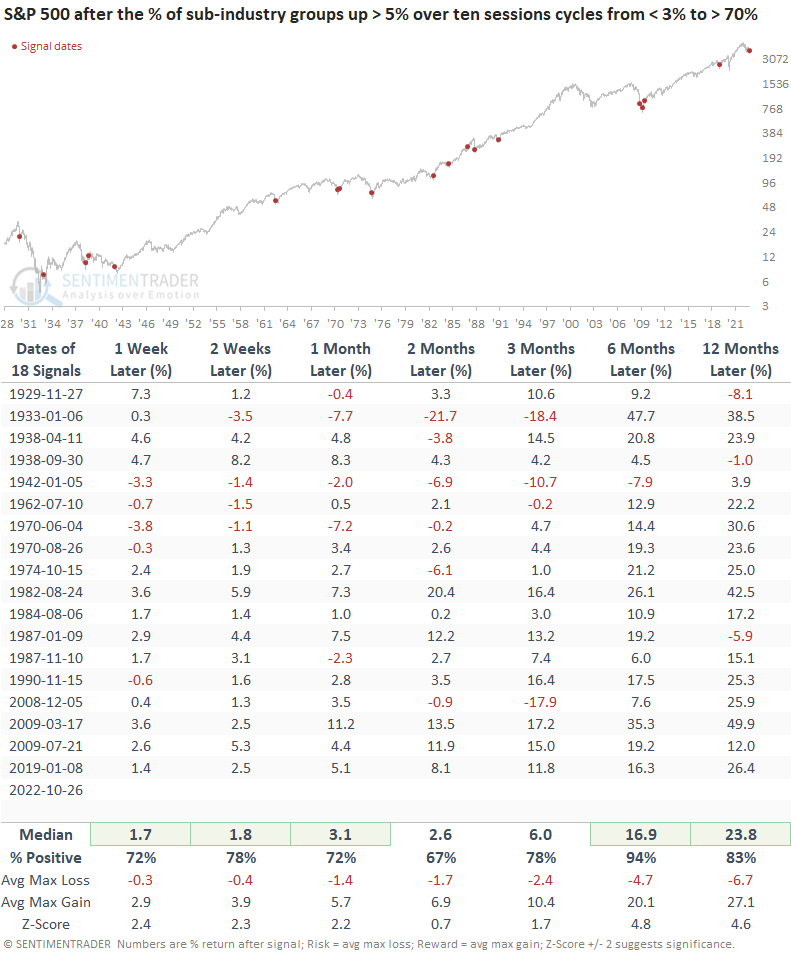
  • After similar reversals, the S&P 500 showed excellent results 6 to 12 months later
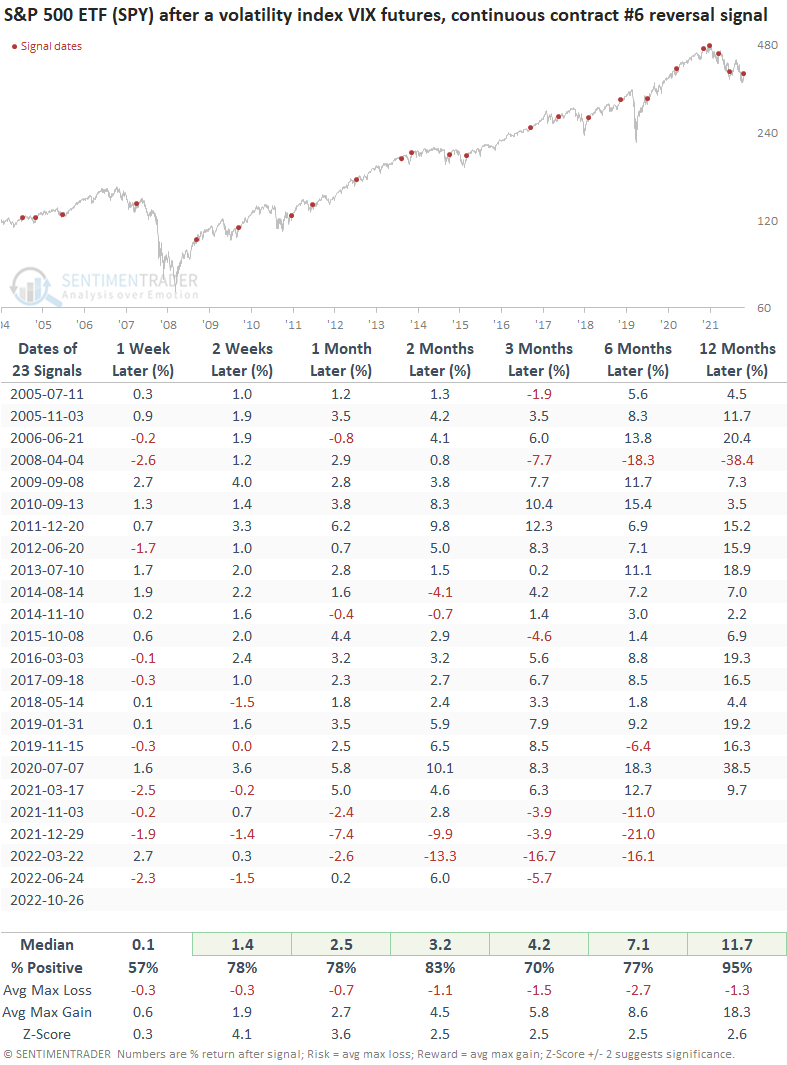
  • Volatility has eased relative to its recent range, triggering a buy signal for stocks

A reversal that suggests the counter-trend rally can continue

In a recent note, I shared a study that showed the market had become oversold again. 

Stocks, excluding some mega-cap technology/communication sector members, have responded to the oversold condition by swiftly reversing higher. 

On Wednesday, the percentage of Sub-Industry groups up > 5% over 10 sessions cycled from < 3% to > 70%. The reversal occurred in only five sessions. 

Similar Sub-Industry group reversals preceded positive returns

When Sub-Industry groups thrust higher in a brief period, the momentum typically leads to more upside momentum. Returns, win rates and z-scores are excellent across all time frames, especially the 6 to 12-month windows. The signal marked several significant bottoms since 1962, with 2008 being an exception.

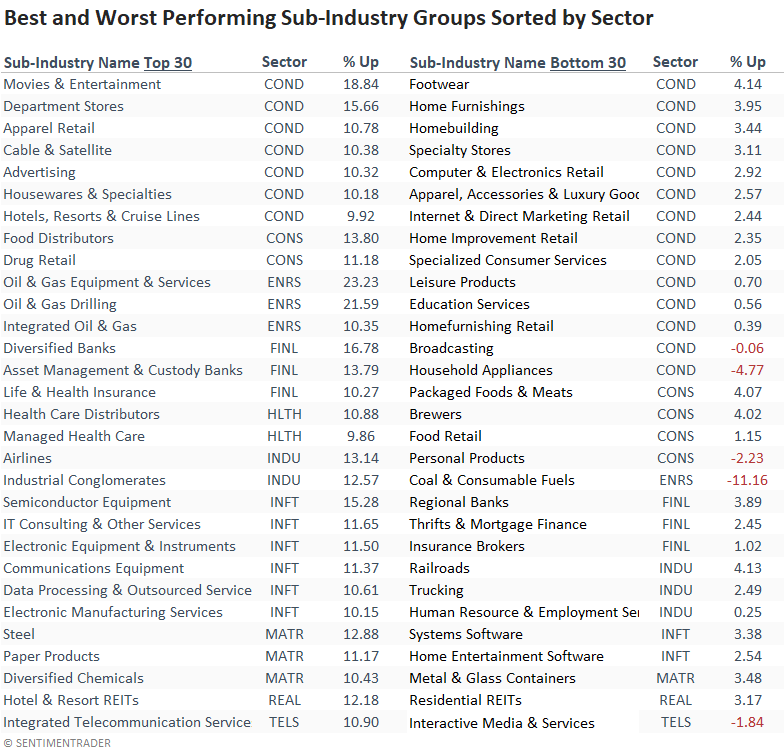
Relative winners and losers over the signal period

Suppose I sort the sub-industries by the top and bottom 30 performing groups over the last ten sessions. In that case, the energy sector has the two best-performing sub-industries. Not surprisingly, several consumer discretionary groups are lagging, especially ones in the housing ecosystem.

Volatility is easing, which is typically a bullish development

The reversal in stocks from the October low has driven volatility lower, which is typically the case after a drawdown phase. However, the easing in volatility is somewhat interesting, given that two significant events are just around the corner in early November; The Fed meeting and the election. 

Volatility could ease further once those events are out of the way.

A trading model that uses VIX futures to identify when volatility cycles from high to low relative to its recent range issued a buy signal at the close of trading on Wednesday.

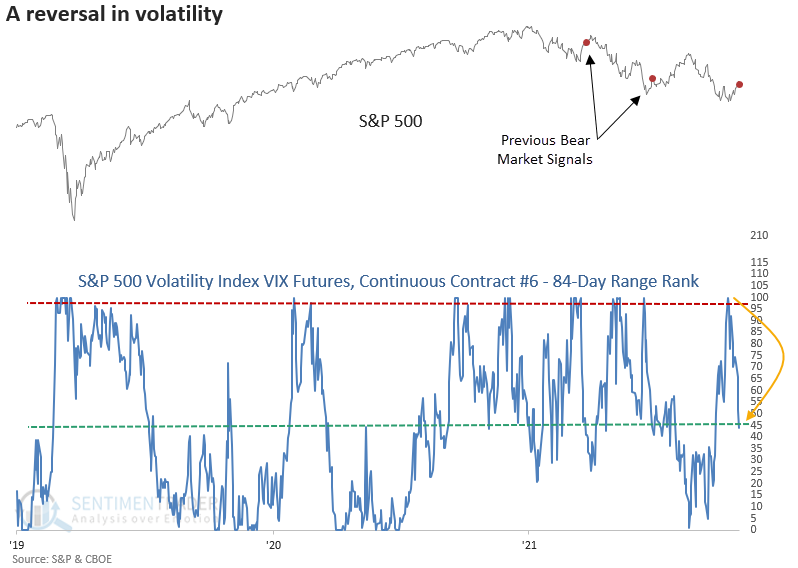
With the VIX futures index data starting in 2005, the range rank signal has benefited chiefly from bull markets. While the sample size is small, the bear market alerts all show a gain at some point in the first two months. In the case of the March 2022 instance, the profit lasted only a short time.

What the research tells us...

In the last few days, a handful of mega-cap growth stocks have imploded, which has pressured the cap-weighted S&P 500. However, performance from a broader basket of stocks, which one can measure with the all-capitalization sub-industry group data, has exploded higher.

The surge in participation from sub-industry groups is a welcome development as it bodes well for a continuation of the counter-trend rally.

With most stocks moving higher, volatility has eased, triggering a bullish buy signal for the market. 

PRODUCTS
SentimenTrader
Trading Tools
Indicators & Data API
‍
Strategies & Scanner
‍
Research Reports
FREE
RESOUrCES
Simple Backtest
Calculator
Simple Seasonality
Calculator
The Kelly Criterion
Calculator
Sentiment Geo Map
‍
Public Research Reports
‍
Education
Sentiment Indicators
‍
Technical Indicators
‍
Pricing
Bundle pricing
‍
FAQ
‍
Announcements
‍
COMPANY
‍
About
‍
In the News
‍
Testimonials
‍
Client Success Stories
CONTACT
‍
General Inquiries
‍
Media Inquiries
‍
Financial Professionals Inquiries
‍
© 2026 Sundial Capital Research Inc. All rights reserved.
Setsail Marketing
TermsPrivacyAffiliate Program
Risk Disclosure: The information and tools provided are for research and analytical purposes only and are not intended as investment advice. Market analysis involves uncertainty, and outcomes may differ from expectations. Users should conduct their own due diligence and consider their individual circumstances before making any financial decisions. Past performance is not necessarily indicative of future results.

Hypothetical Performance Disclosure: Hypothetical performance results have many inherent limitations, some of which are described below. No representation is being made that any account will or is likely to achieve profits or losses similar to those shown; in fact, there are frequently sharp differences between hypothetical performance results and the actual results subsequently achieved by any particular trading program. One of the limitations of hypothetical performance results is that they are generally prepared with the benefit of hindsight. In addition, hypothetical trading does not involve financial risk, and no hypothetical trading record can completely account for the impact of financial risk of actual trading. for example, the ability to withstand losses or to adhere to a particular trading program in spite of trading losses are material points which can also adversely affect actual trading results. There are numerous other factors related to the markets in general or to the implementation of any specific trading program which cannot be fully accounted for in the preparation of hypothetical performance results and all which can adversely affect trading results.

Testimonial Disclosure: Testimonials appearing on this website may not be representative of other clients or customers and is not a guarantee of future performance or success.