
Some interesting insider signals under the surface

Key points
- Overall, insider activity is not favorable
- However, our Corporate Insider Velocity indicator - which is designed to note subtle but important shifts in insider sentiment - has flashed several favorable signals recently for the year ahead
- Importantly, these signals are more "look for a buying opportunity in the year ahead" than "buy right now" signals.
- The sectors highlighted below include healthcare, consumer discretionary, technology and consumer staples
Overall, Insider is essentially neutral
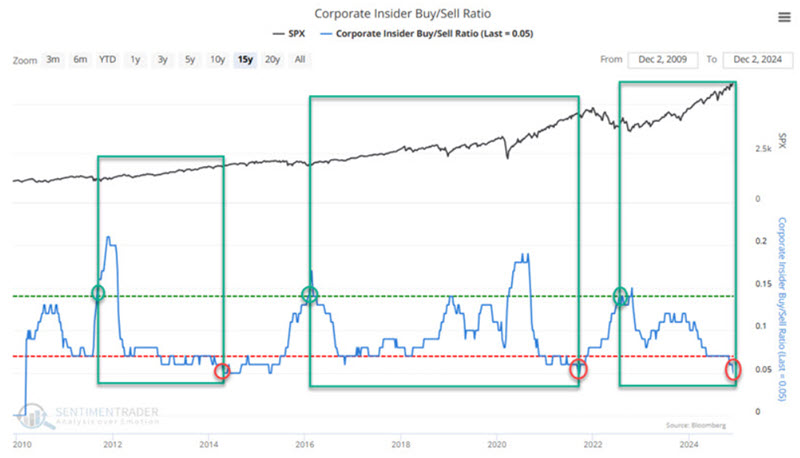
For the record, I generally rate overall corporate insider activity as "favorable" or "neutral" (but rarely as outright "unfavorable" or bearish. In this note, in December 2024, I noted that my primary insider indicator had fallen into neutral territory. The screenshot below appeared in that note.
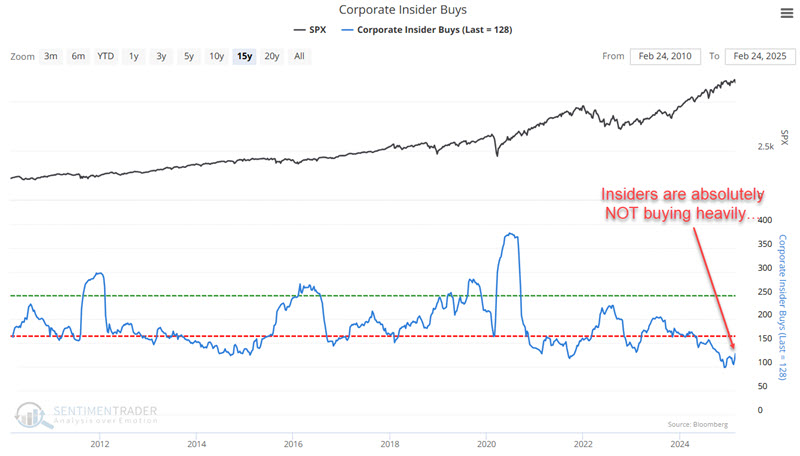
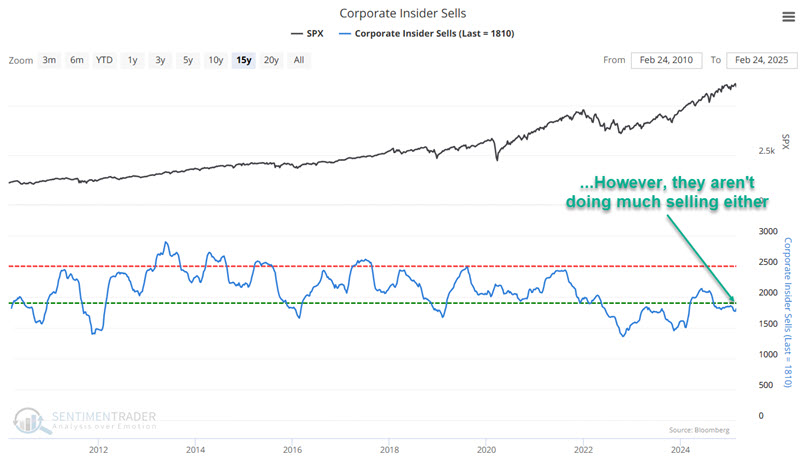
Interestingly, both insider buying and insider selling are at relatively low levels. Theoretically, the former is bad, and the latter is good. So again, the message is basically "neutral" (implying neither bullish nor bearish things specifically).
Our Corporate Insider Velocity indicator shows the velocity of corporate insider buying versus selling. It takes a 4-week rate of change for insider buys and subtracts a 4-week rate of change for insider sales.
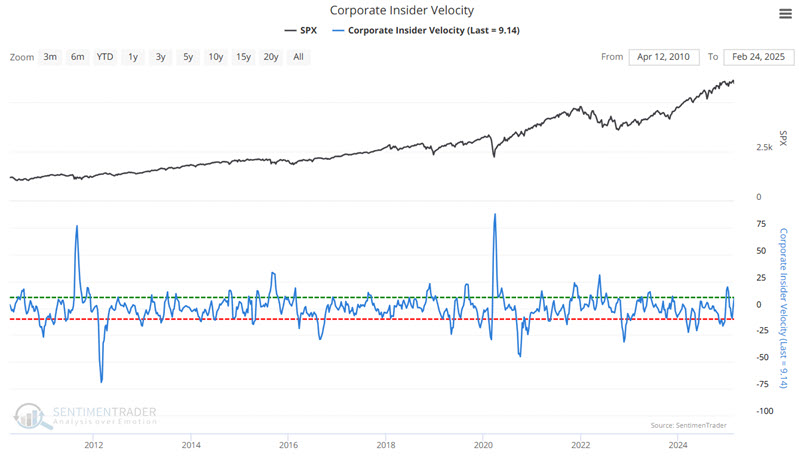
Generally speaking:
- Extremes in insider activity (high or low) have tended to be favorable for the underlying index or sector
- Extreme readings are often "early" and serve more as an "alert" than as actual trading signals
- Reversals from extremes are often an excellent time to consider entering a position
- Lastly, signals from this indicator are generally best used in conjunction with other information and not as a standalone trading model
Some interesting signals often come from zeroing in on specific sector activity.
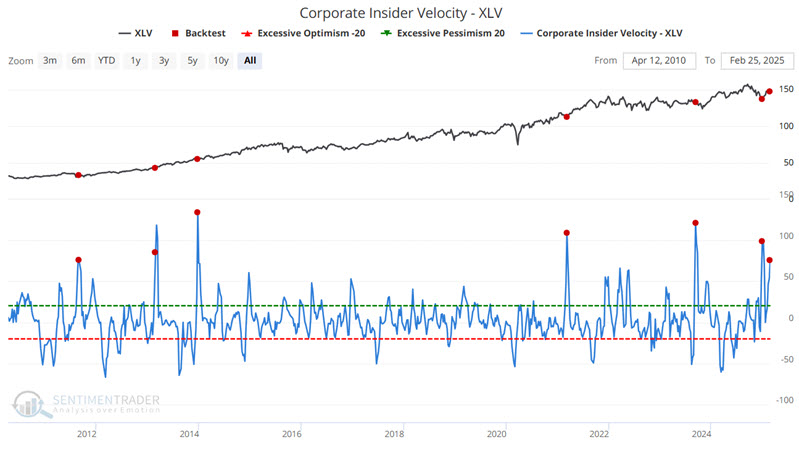
The Healthcare sector
The chart below highlights the dates when the Corporate Insider Velocity-XLV indicator crossed above 75. Note that some signals were early. The most recent signals occurred on 2024-12-30 and 2025-01-24.
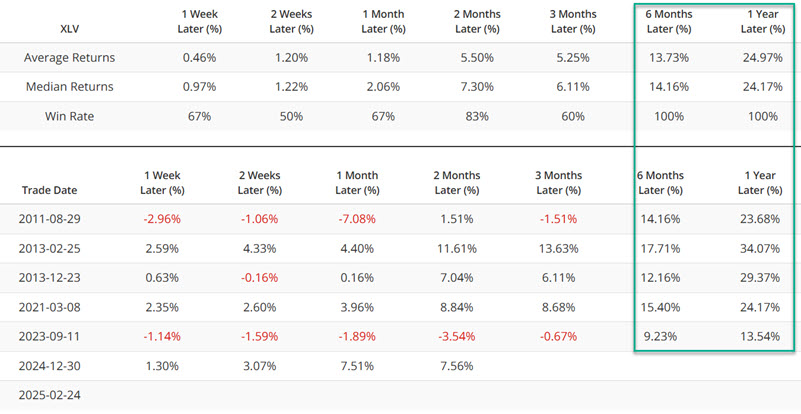
The table below summarizes subsequent XLV performance.
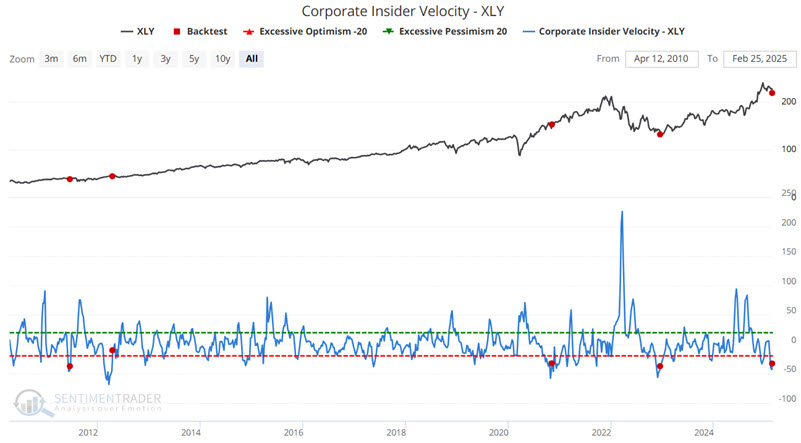
The Consumer Discretionary sector
The chart below highlights the dates when the Corporate Insider Velocity-XLY indicator crossed above -40 for the first time in three months. The most recent signal occurred on 2025-02-24.
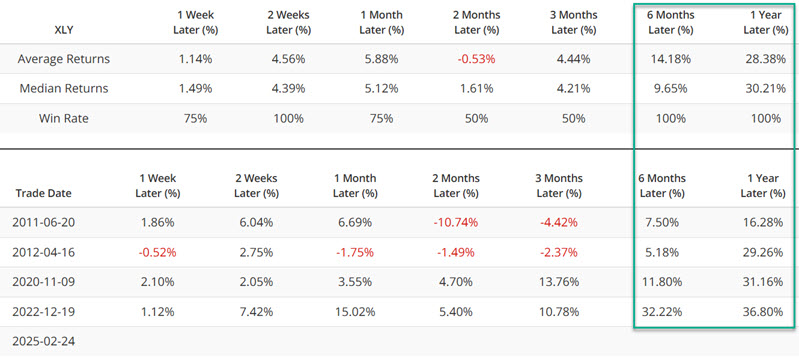
The table below summarizes subsequent XLY performance. The 1-Year Win Rate of 100% and Median Return of 30.21% are certainly compelling. However, as always, past performance in no way guarantees future performance.
The Technology sector
Now, let's turn our attention to the technology sector. The chart below highlights the dates when the Corporate Insider Velocity-XLK indicator crossed above -23 for the first time in three months. The most recent signal occurred on 2025-12-18.
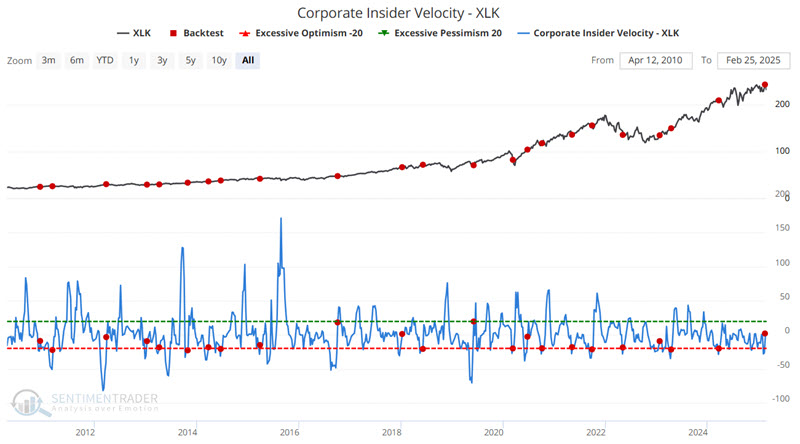
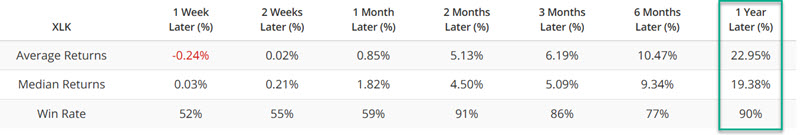
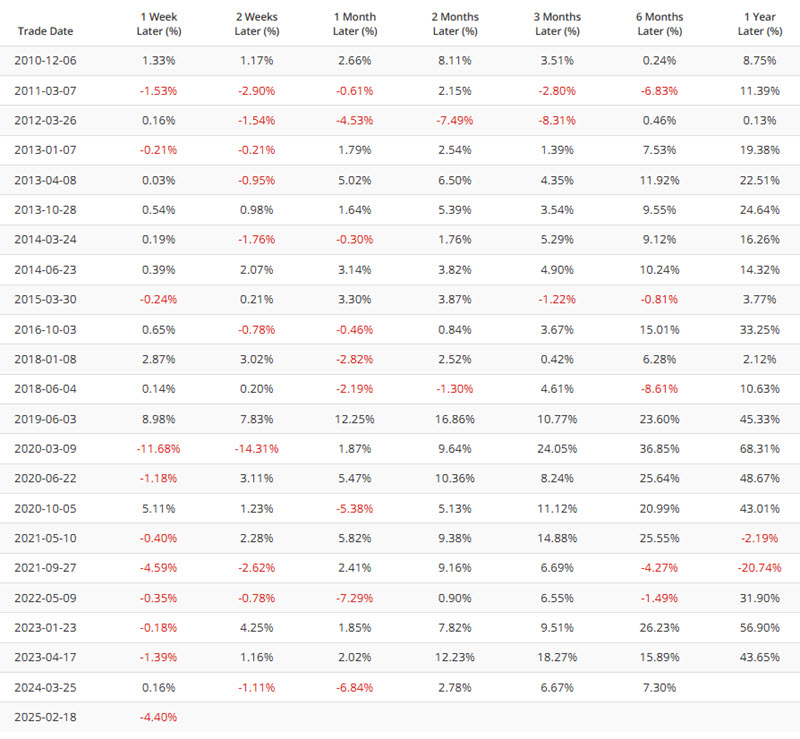
The table below summarizes subsequent XLK performance.
The Consumer Staples sector
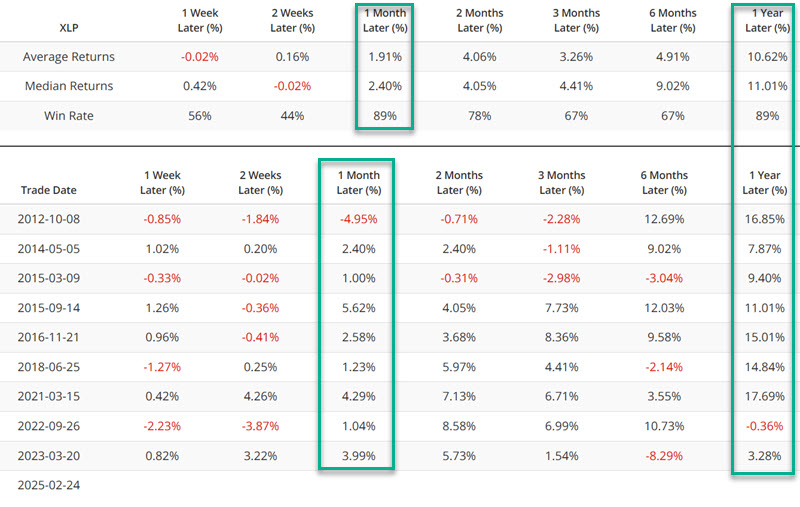
Now, let's turn our attention to the consumer staples sector. The chart below highlights the dates when the Corporate Insider Velocity-XLP indicator 20-week average crossed above 10. The most recent signal occurred on 2025-02-24.
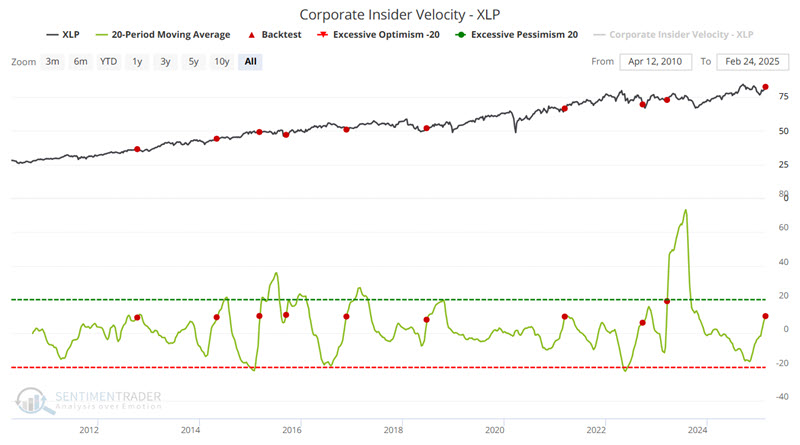
The table below summarizes subsequent XLP performance.
What the research tells us…
The most important thing to remember is that none of the information above constitutes a "buy signal" by itself. These are strictly "weight of the evidence" indicators that alert us that opportunities may be forming in the highlighted sectors. High twelve-month Win Rates in the past are never a guarantee of future performance. That said, they do tend to offer important clues for investors and traders looking for opportunities to achieve above-average performance. The bottom line: Monitor these sectors and do not get caught sleeping if they start to rally during the year ahead.