
Some indicators still suggesting caution in TLT

Key points
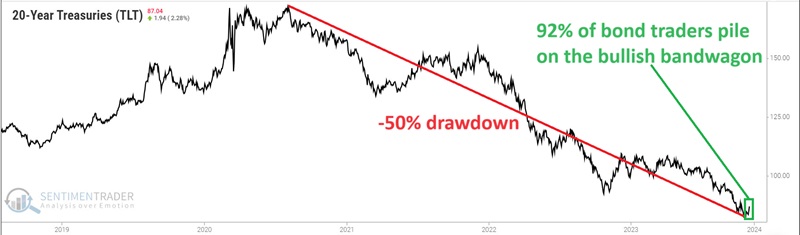
- The narrative seems to be that after an unprecedented drawdown, the worst is over in long-term treasury bonds
- Traders rushed to the bullish side during the latest bond market bounce
- A handful of indicators suggest that further consolidation and testing may be in the offing before any sustained upturn unfolds
TLT Optix spikes with price in a downtrend
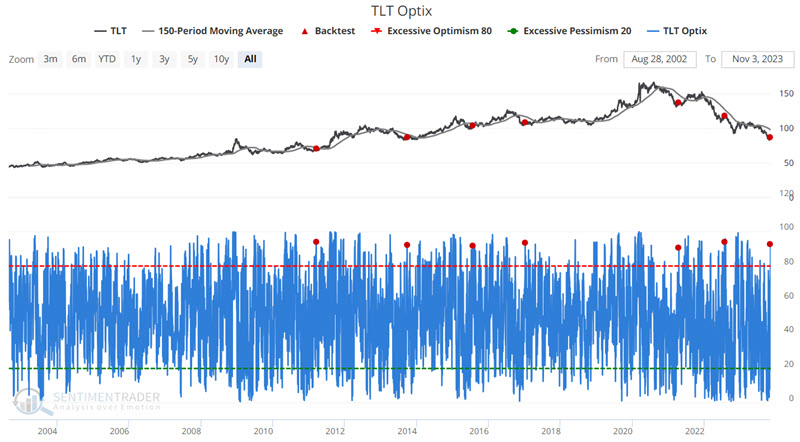
The long-term treasury bond has gotten so oversold that many assume it "has to bounce" at some point. And to an extent, they are correct. No market moves in a straight line in one direction forever. It is human nature to feel the urge to pick a bottom in a market that appears to be vastly oversold. Thus, at the first sign of an upturn, the pent-up bullishness often reveals itself in our Optix calculations.
The chart below displays the last five years of iShares 20 Plus Year Treasury Bond ETF (ticker TLT) performance. Traders wasted little time piling onto the bullish bandwagon when TLT showed the faintest signs of life.
Unfortunately for bond traders, historically, when this spike in bullish sentiment occurs while prices are still in a downtrend, it tends to be premature. The chart below highlights those rare occasions when TLT Optix crossed above 90% while ticker TLT was below its 150-day moving average. The latest signal occurred on 2023-11-02.
The table below summarizes subsequent TLT performance.
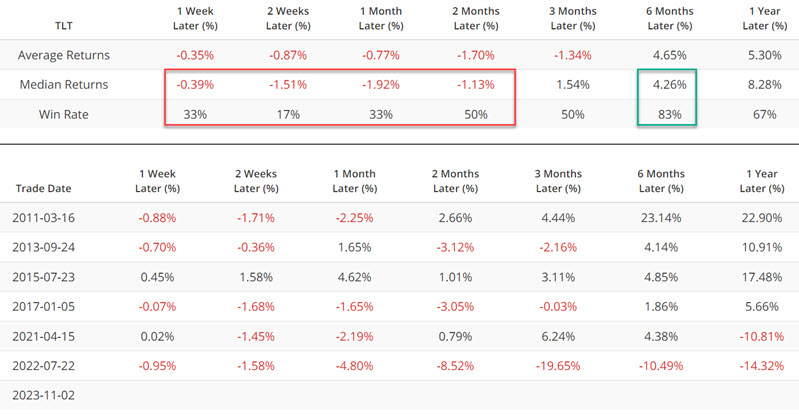
Typically, TLT has struggled during the 1-week to 2-month periods following previous signals. Interestingly, six-month returns were positive 83% of the time. This would seem to argue for bond traders to remain patient and look for another buying opportunity in the weeks ahead rather than plunging in immediately.
What consumer confidence in stocks says about bonds
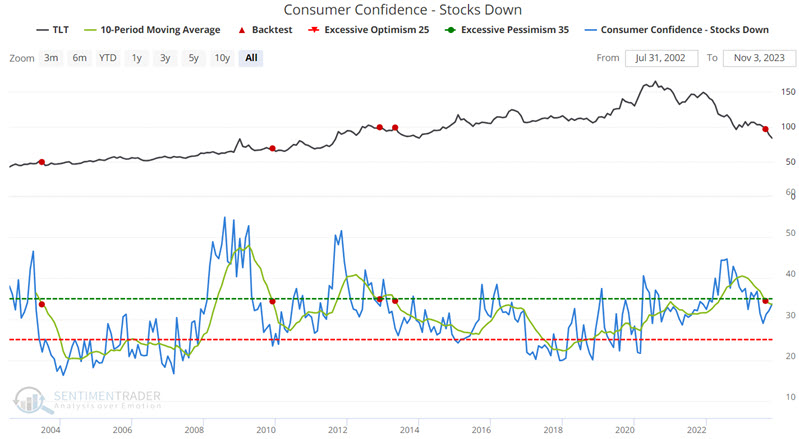
The Consumer Confidence - Stocks Down indicator shows the net percentage of consumers expecting stocks to decrease, according to a monthly survey from the Conference Board. The chart below highlights TLT performance following those occasions when the 10-month moving average of this indicator crossed below 35. The most recent signal occurred on 2023-08-31.
The table below summarizes subsequent TLT performance.
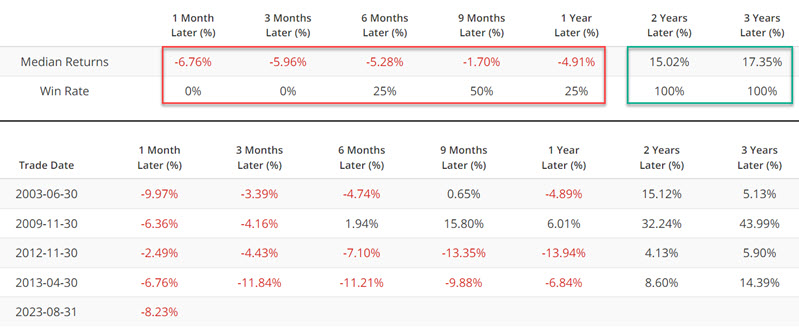
The sample size is tiny, so this should not be relied upon as a standalone model. As weight of the evidence, however, it argues for the possibility of continued weakness in the bond market for the next 1 to 4 months. Like the indicator above, this one also appears to be arguing for patience in the bond market.
The Copper/Gold Ratio weighs in
We must admittedly file this one under the category of "relationships that intuitively don't make sense." One can reasonably invoke the "correlation without causation" adage regarding the relationship between the Copper/Gold Ratio and long-term treasury bonds. Nevertheless, the results are compelling enough - and fit well enough with those above - that we will present them for your consideration.
The chart below highlights all days when the Copper/Gold ratio was below 0.20. The Copper/Gold Ratio presently stands at 0.184.
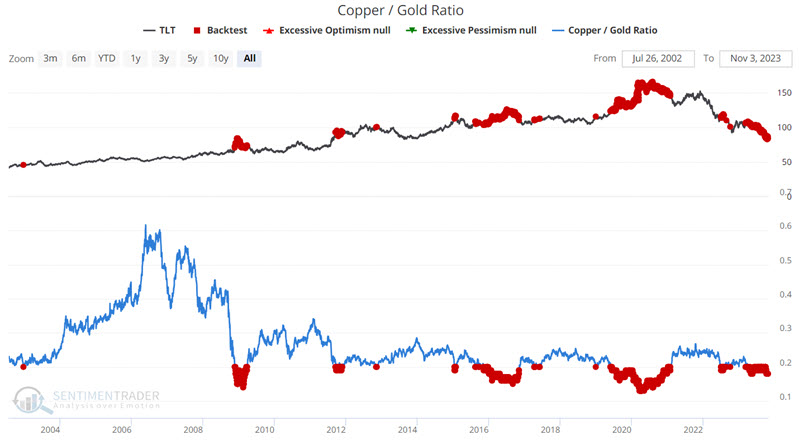
The table below summarizes subsequent TLT performance.
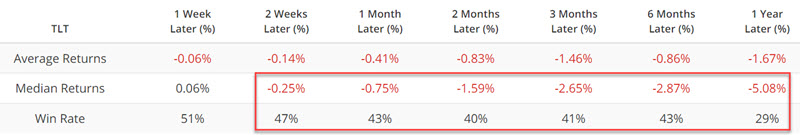
Like the indicators above, it would likely be a mistake to attempt to use this as a standalone trading model to trade bonds. Still, by coincidence or not, Copper/Gold Ratio readings below 0.20 have tended to presage weakness in long-term treasury bonds - even before the low in interest rates in 2020.
What the research tells us…
Long-term treasury bonds suffered a staggering 50% drawdown from their 2020 high to their recent low. It is only natural to expect a rebound rally of some degree. However, traders were suspiciously quick to leap onto the bullish bandwagon at the first sign of relief. Are they correct? Is the worst over for bonds? We cannot predict. However, we can note that many times in the past, a market that suffered a sharp decline often experienced a great deal of volatility while trying to put in a final bottom. Retests of the initial low - and occasional false breakdowns - are not uncommon. This historical precedence, combined with the short-term weakness that has generally followed the indicator signals above, suggests that bond buyers temper their enthusiasm for long-term bonds in the near term. A bottom may be forming, but there may be some significant volatility ahead.