
Some gathering clouds for regional bank sector

Key points
- Regional bank stocks spiked higher by over 25% in a month since mid-June
- In the process, several potential warning signs have emerged regarding the months ahead
- Sentiment, macro, and seasonal factors will soon weigh on this sector
- The message may be less "regional banking is doomed to fall hard," and more "investors might do well to focus elsewhere" in the near-term"
Price action has been favorable
The regional banking sector has been acting well on a trend-following basis. The chart below shows that the SPDR S&P Regional Banking ETF (ticker KRE) has made a series of higher lows since bottoming in May 2023. Price declines in 2024 have repeatedly found support at the 200-day moving average, and in the last month, the price has shot higher above a rising 200-day moving average.
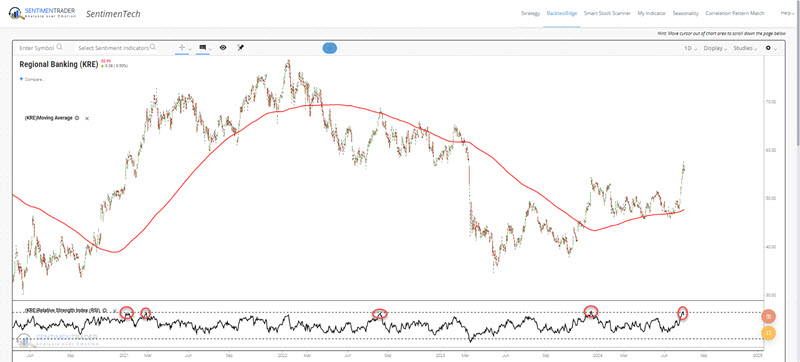
It is difficult to argue that price action is anything other than favorable at the moment. The 14-day RSI shown in the bottom clip of the chart above suggests that KRE may be somewhat overbought and due for a pullback. Nevertheless, fighting the current trend is risky. With that important caveat in mind, let us turn our attention to some potential warning signs that are arising.
Sentiment has spiked to an overly bullish level
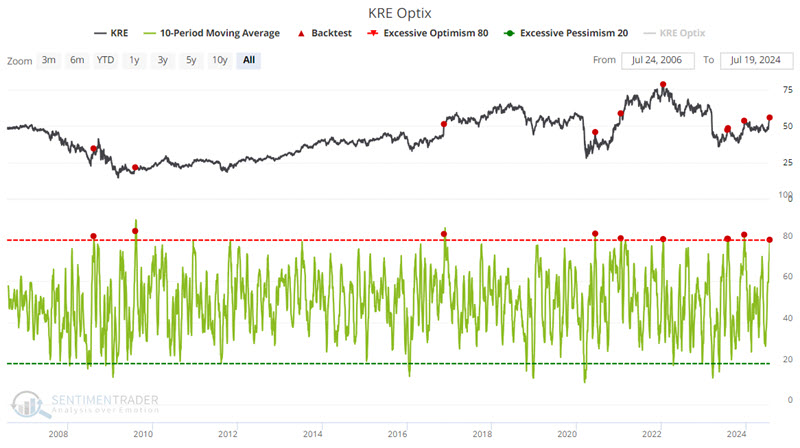
The chart below highlights all dates when the 10-day average of our KRE Optix indicator crossed above 80. The most recent signal occurred on 2024-07-19.
The table below summarizes KRE's performance following the dates highlighted above.
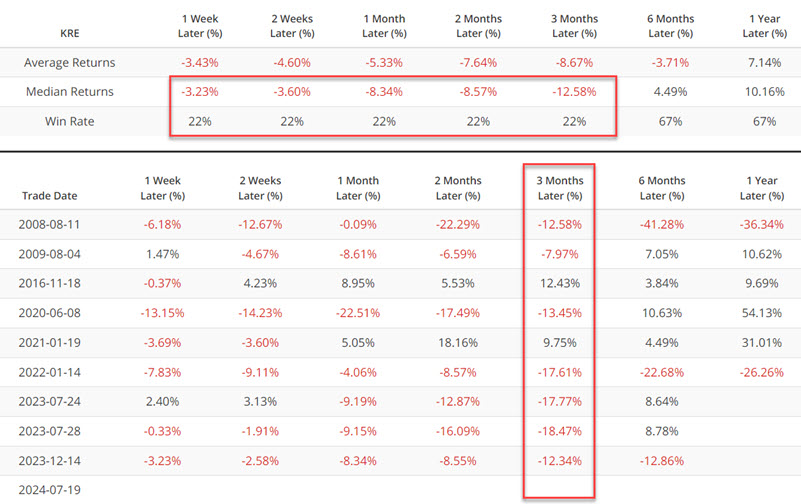
The critical thing to note is the 22% Win Rate for each time from through three months after a signal. This does not guarantee a decline for KRE between now and mid-October, but it does stand as a near-term warning sign for traders and investors.
The Copper/Gold Ratio keeps falling
The chart below highlights those rare occasions when the Copper/Gold Ratio crossed below 0.18 for the first time in six months, and the table summarizes KRE's performance following these dates. As you can see, this does not happen often. The most recent signal occurred on 2024-07-17.
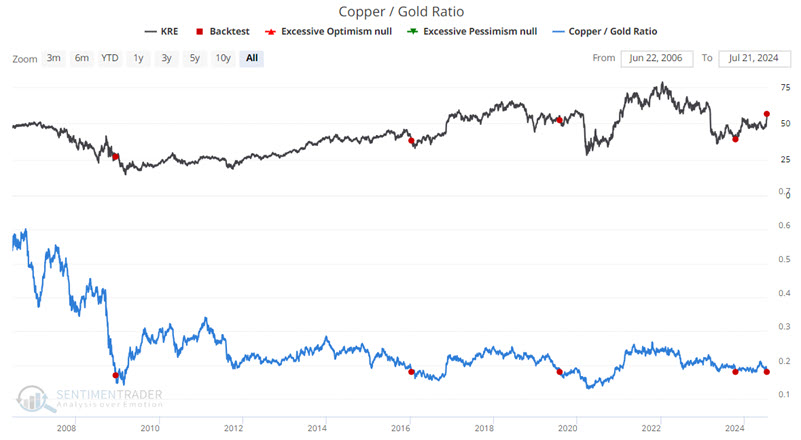
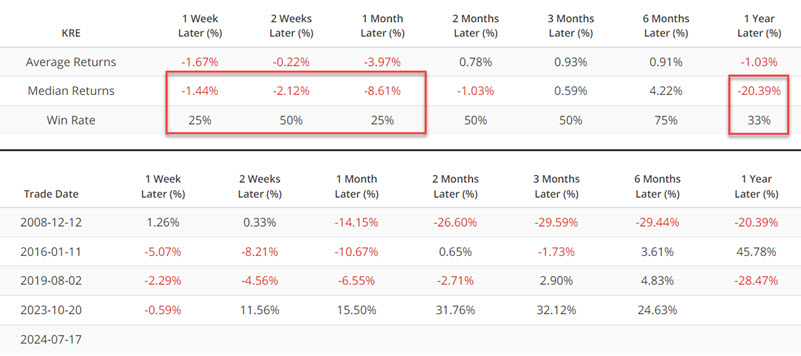
Note that the sample size is too small to draw definitive conclusions from and that historical results are not uniformly unfavorable (the October 2023 signal occurred close to a price low). However, median returns are negative through two months, which dovetails with the Optix indicator results above.
Seasonality may weigh on regionals in the months ahead
The chart below displays the annual seasonal trend for ticker KRE.
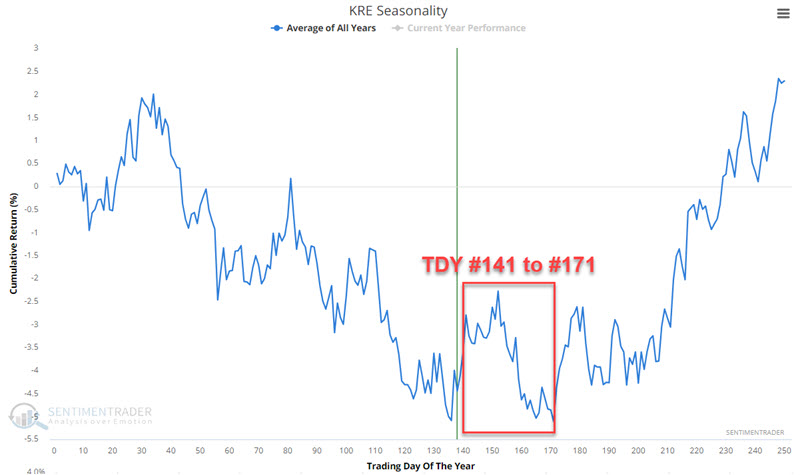
There are two caveats here:
- The seasonal trend will not be technically unfavorable until at least Trading Day of the Year (TDY) #141 (2024-07-24) or even until TDY #152 (2024-08-08)
- KRE bucked the generally unfavorable tendency in recent months to spike sharply higher
So, one can reasonably argue that seasonality is not presently an unfavorable factor and that even if it was, KRE has not followed its average seasonal trend. But again, we are looking at potential storm clouds on the horizon. In the chart above, we highlighted the TDY #141 through TDY #171 period with a red box. For 2024, this period extends from the close on 2024-07-24 through 2024-09-05. The chart below displays the cumulative growth of $1 invested in KRE only during this period since KRE started trading in 2007.
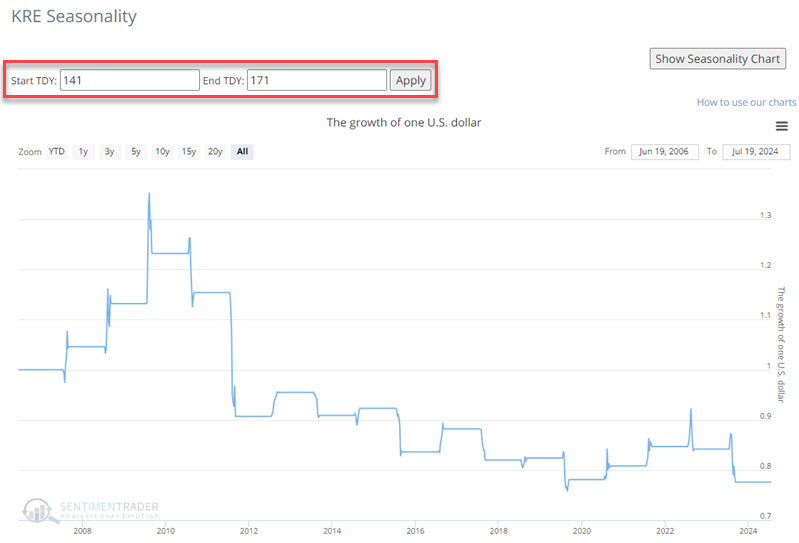
Note that results are by no means unfavorable every year. However, the point is to highlight that this is another indicator of potential underperformance for regional banks in the months ahead.
We highlight the TDY #152 through TDY #171 period highlighted in the chart below. For 2024, this period extends from the close on 2024-08-08 through 2024-09-05.
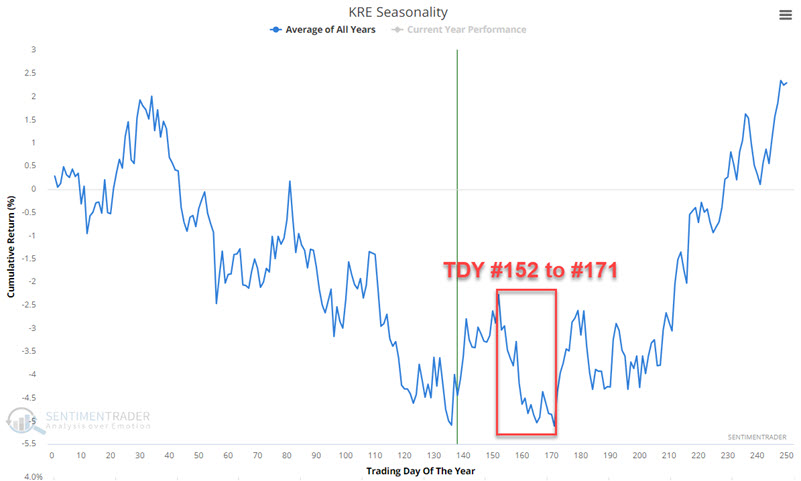
The table below displays the cumulative growth of $1 invested in KRE only during this period since 2007.
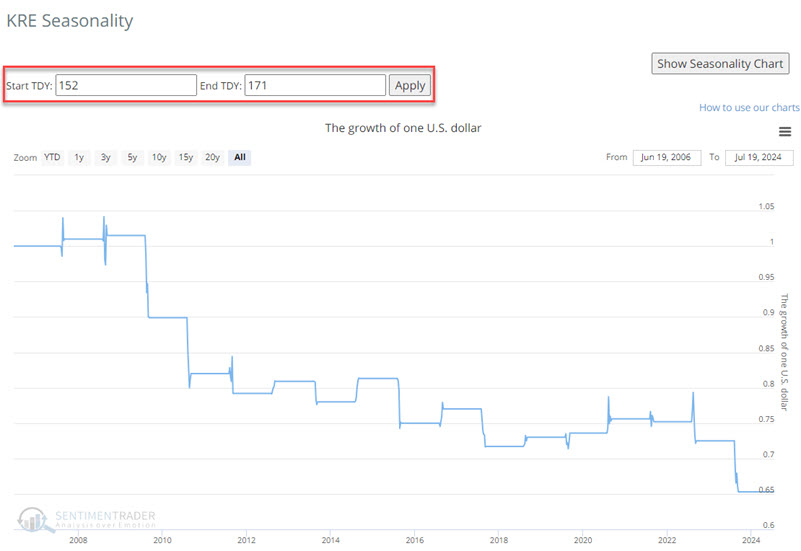
Again, the message is not that regional banks are doomed to decline during this period in any given year but rather that making money in regional stocks during this period has tended to be difficult.
What the research tells us…
To reiterate, regional bank stocks are presently in a price uptrend. Trying to "pick the top" in anything is typically a fool's errand, and suggesting that regional banks have "topped out" and/or are doomed to decline in the weeks ahead is not the argument here. The information highlighted above suggests that longer-term investors may be wise to look for opportunities elsewhere rather than chasing regional banks here and that shorter-term traders should keep a close eye for any signs of a reversal in the regional banking sector between now and mid-October.