
Some evidence is accumulating on the favorable side of the ledger

Key points
- Most indicators are not meant to be used as "trading systems" but rather as "weight of the evidence"
- In this piece, we highlight a variety of indicators that ultimately seem to be saying the same thing
- We look at IPOs relative to SPX, OEX Open Interest, the Panic/Euphoria Model, and two Technology indicators
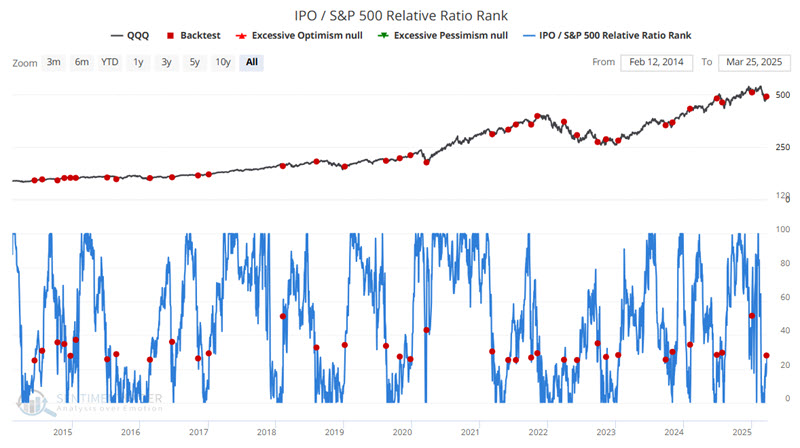
IPO / S&P 500 Relative Ratio Rank
This risk-on/risk-off indicator examines the performance of initial public offerings versus the S&P 500. It shows the ratio relative to its range over the past four months. When the relative ratio is high, investors show risk-on behavior. When the ratio drops to a low level, they exhibit risk-off behavior. In addition, when it rises from a low level, it also tends to highlight risk-on behavior, sometimes before other indicators.
The chart below highlights every date the indicator crossed above 25 for the first time in a month.
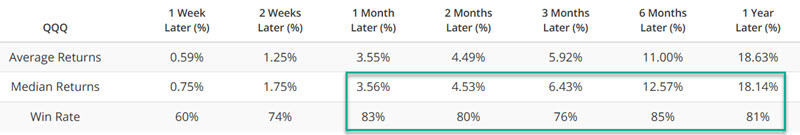
The table below summarizes ticker QQQ performance following the signals in the chart above. The key point is the consistently high Win Rates across the board.
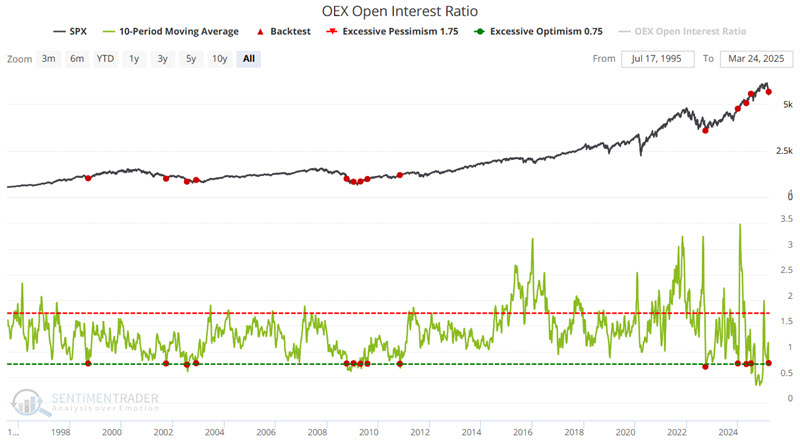
OEX Open Interest Ratio
OEX is shorthand for the S&P 100, an index of the 100 largest companies in the S&P 500. Open interest is defined as the total number of option contracts outstanding. Open interest is increased by opening transactions and decreased by closing transactions. Someone buying a call to open (a bullish position) would increase open interest by one, and someone selling a call to open (a bearish position) would also increase open interest by one.
The open interest indicator takes the total put open interest and divides it by total call open interest - as more put contracts are opened (and/or call contracts closed), the indicator rises; as put contracts are closed (and/or call contracts opened), the indicator falls. The OEX put/call open interest ratio should be considered non-contrarian. As put open interest rises in relation to call open interest, it suggests that OEX option traders - usually quite successful at identifying market turning points - are accumulating put positions. This is a bearish development. Conversely, if OEX traders are accumulating call positions, the put/call open interest ratio should fall, which is usually bullish.
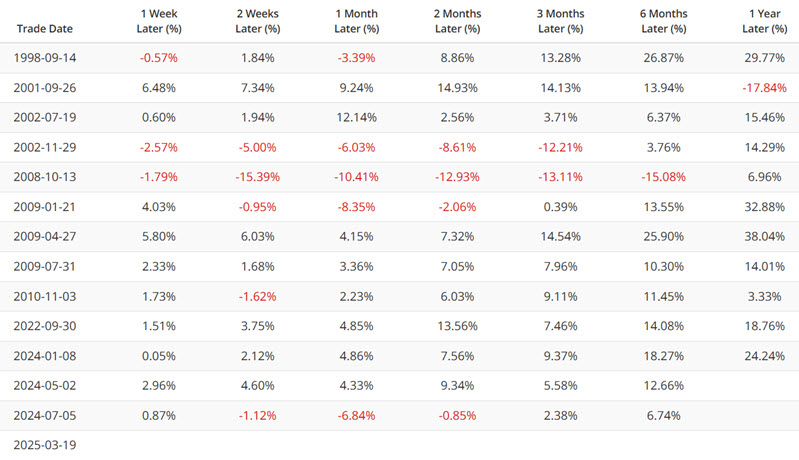
Like the indicator above, when this indicator rises from a low level, it also tends to highlight risk-on behavior. The chart below highlights all dates when the 10-day average of the OEX Open Interest Ratio indicator crossed above 0.78 for the first time in two months.
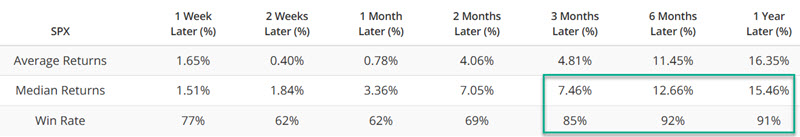
The tables below display S&P 500 performance following the signal dates in the chart above.
Panic/Euphoria Model
During the recent stock market pullback, investors essentially stampeded to the bearish side of the street. As a contrarian indicator, this is typically a favorable sign. One way to quantify this is with our Panic/Euphoria Model.
Our Panic/Euphoria model is based on the Citi Panic / Euphoria model published in Barron's magazine. It does not reflect those published values; instead, it is our interpretation of the model inputs and construction and differs modestly from the published figures. The inputs are the same, however its performance as a contrary indicator is improved over the published values. It comprises the following primary inputs: NYSE short interest, margin debt, Nasdaq vs NYSE volume, Investor's Intelligence survey, AAII survey, retail money market funds, put/call ratios, commodities prices, and retail gasoline prices. The higher the model, the more investors are in a euphoric mood, with lower expected stock returns going forward. Low values, particularly below zero, suggest investors have panicked, and higher forward returns are expected.
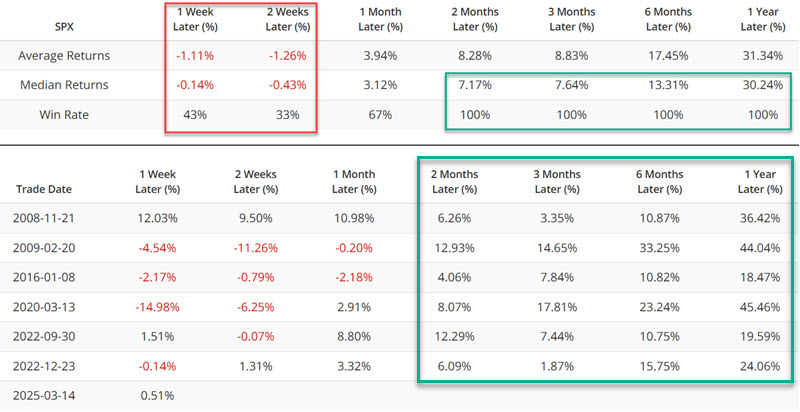
The chart below highlights those dates when our Panic/Euphoria Model crossed below -0.27 for the first time in three months.
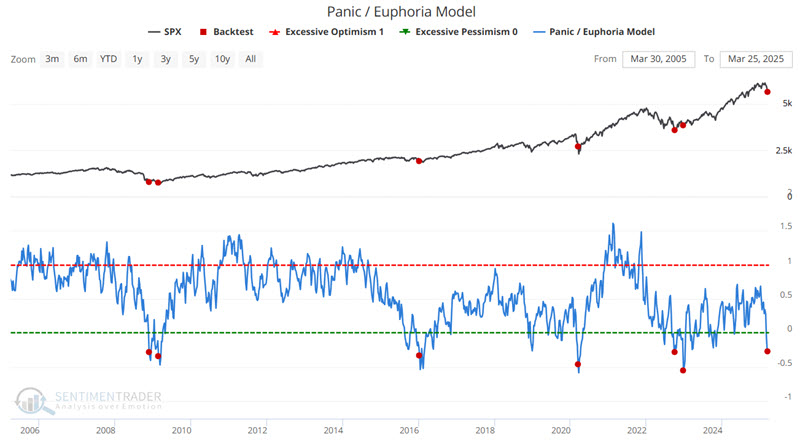
The table below summarizes subsequent S&P 500 performance following the highlighted signal dates.
Could technology recover?
The technology sector enjoyed a massive run in recent years, and many feel it will now lag-ala 2000 to 2002-for the foreseeable future. Still, some signs suggest that investors should not give up on tech just yet.
Our XLK Component Correlation indicator measures the correlation among members of the XLK constituent stocks. During times of panic, investors tend to buy or sell "everything" together, no matter their individual merits, so correlation rises. The higher it goes, the more we see groupthink, which tends to happen at times of extreme pessimism and is thus usually a positive for stocks in the future. When conditions are calm, and investors become complacent, they trade stocks on their own merits, and correlation drops. That tends to lead to below-average returns for the sector going forward. However, when the value rises from a low level, it can provide an early alert signal.
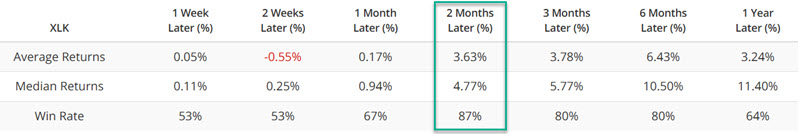
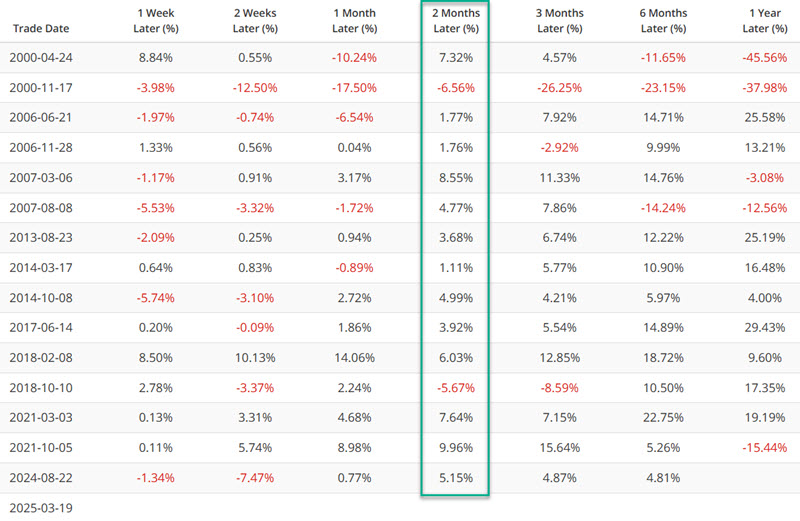
The chart below highlights those dates when the 10-day moving average of our XLK Component Correlation indicator crossed above 0.50 for the first time in three months.
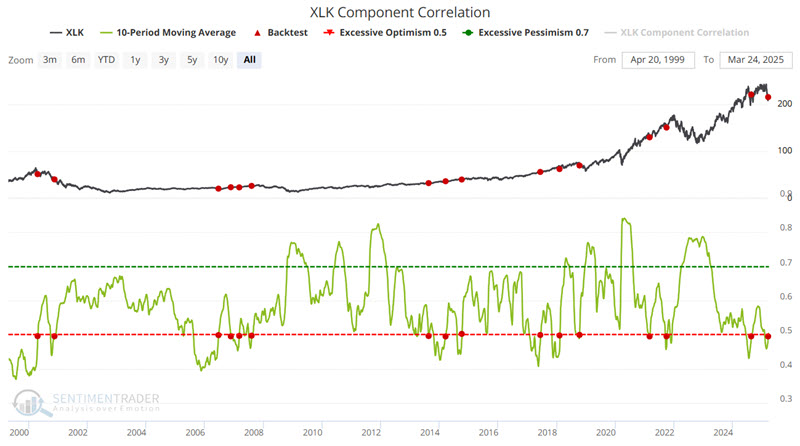
The tables below summarize XLK's performance following the dates highlighted in the chart above. The most consistent period appears to be the two months after a signal.
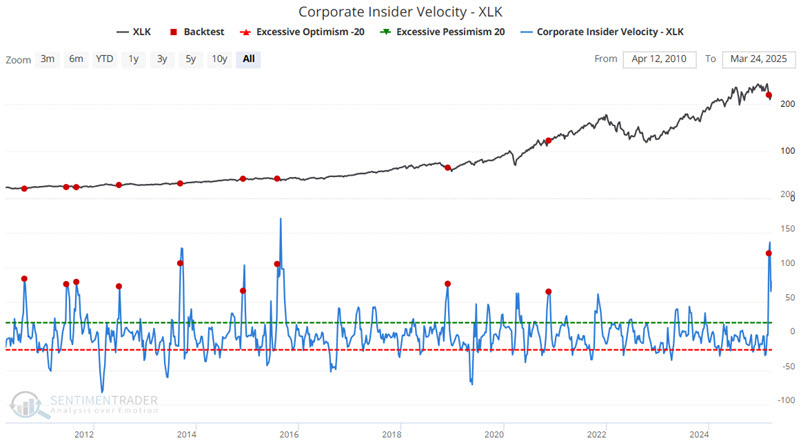
Speaking of the technology sector, the four-week change in corporate insider buying versus selling recently crossed an interesting threshold. While our insider velocity indicators do not necessarily highlight massive insider buying nor a dearth of insider selling, they can detect subtle but important shifts in insider (i.e., smart money) sentiment.
The chart below highlights those dates when our Corporate Insider Velocity - XLK indicator crossed above 64.
The table below summarizes XLK performance following the signal dates highlighted in the chart above.
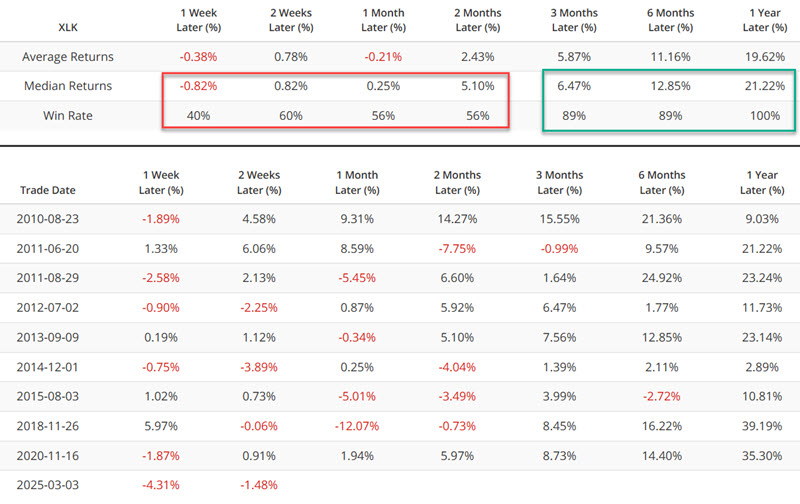
This signal has tended to be followed by tech strength in the subsequent three to twelve months.
What the research tells us…
The reality is that none of the above signals should be considered an outright "buy signal." They all fall instead under the heading "Weight of the Evidence." What is significant, however, is that a) they all fall on the same side of the ledger (i.e., favorable), and b) they all have a decent track record of being right. The message appears that - while volatility and uncertainty remain - longer-term investors should continue to give the bullish case the benefit of the doubt.