
Some early cracks in high-yield bonds

Key points:
- Junk bonds have not kept up with the torrid pace of gains in stocks, forming some divergences
- Longer-term breadth measures for the high-yield bond market are diverging from stocks
- There are few precedents for similar behavior, but the ones that exist suggest limited upside
Junk bond investors aren't quite so bullish
When things get so good that it's hard to imagine anything going wrong, it's often (not always) a good time to be nervous. Reasons tend to come out of nowhere, markets rarely reward overconfidence.
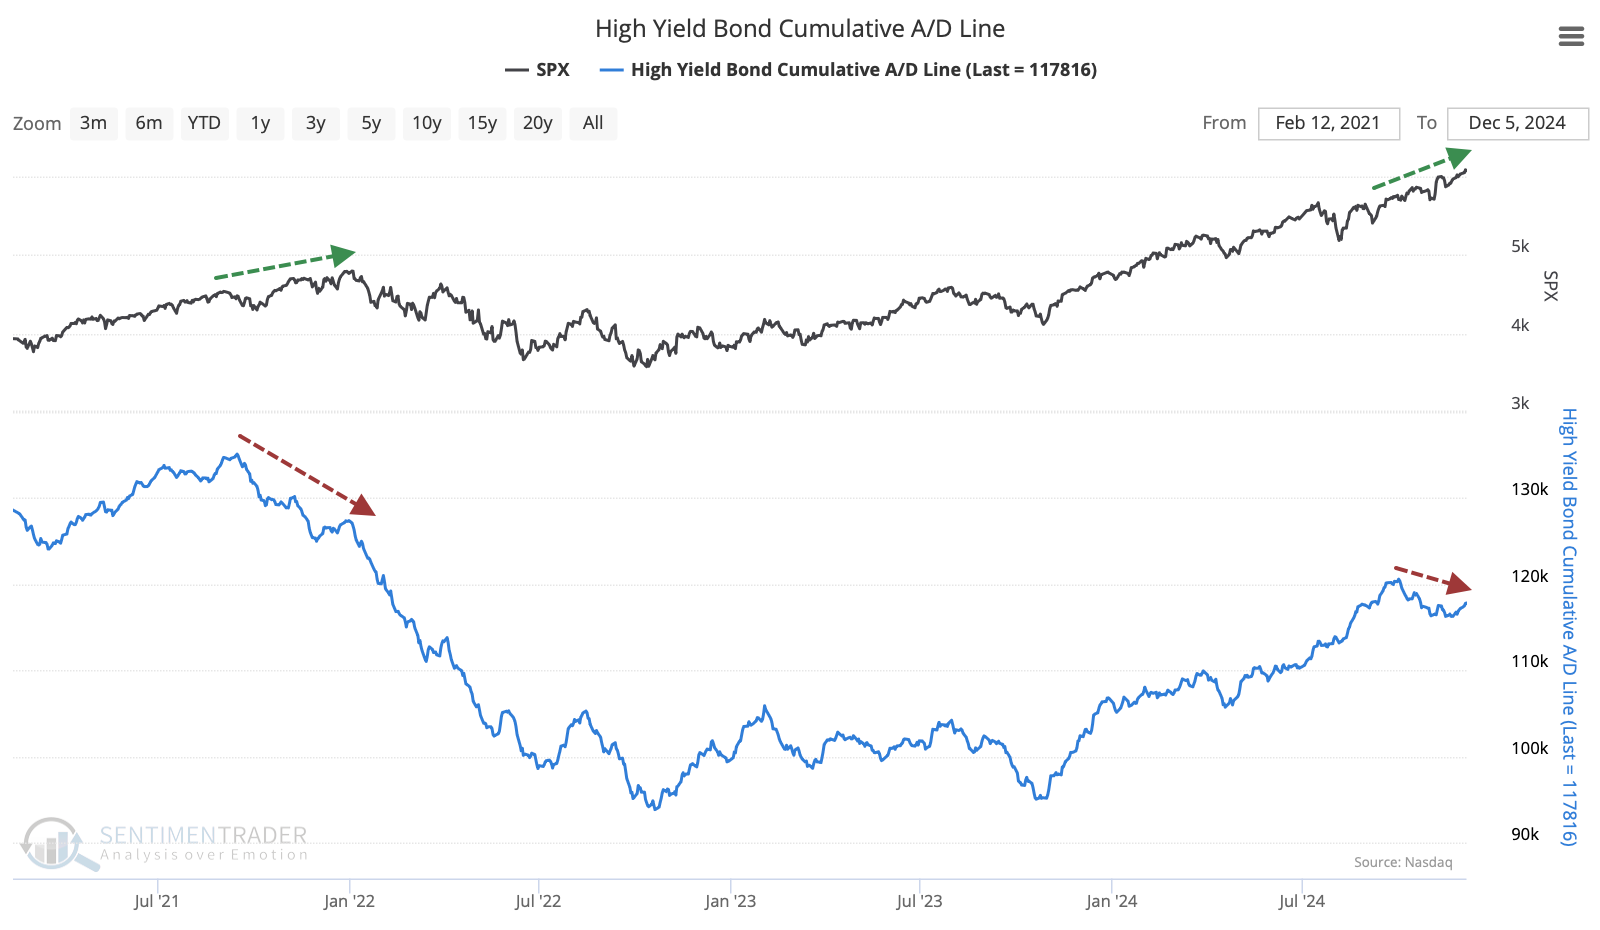
One of our favorite early-warning markets is the high-yield (junk) bond market. When investors begin to worry about credit quality, it has often given a heads-up as equity investors were more focused on the upside instead of possible downside.
At the risk of making mountains out of molehills, there are some developing concerns in that market. Fewer bonds have been rallying recently, forming a divergence for the first time since 2021. As the S&P 500 has been notching new highs, fewer and fewer high-yield bonds have been rallying, and the High-Yield Cumulative Advance/Decline Line hasn't eclipsed its September high.
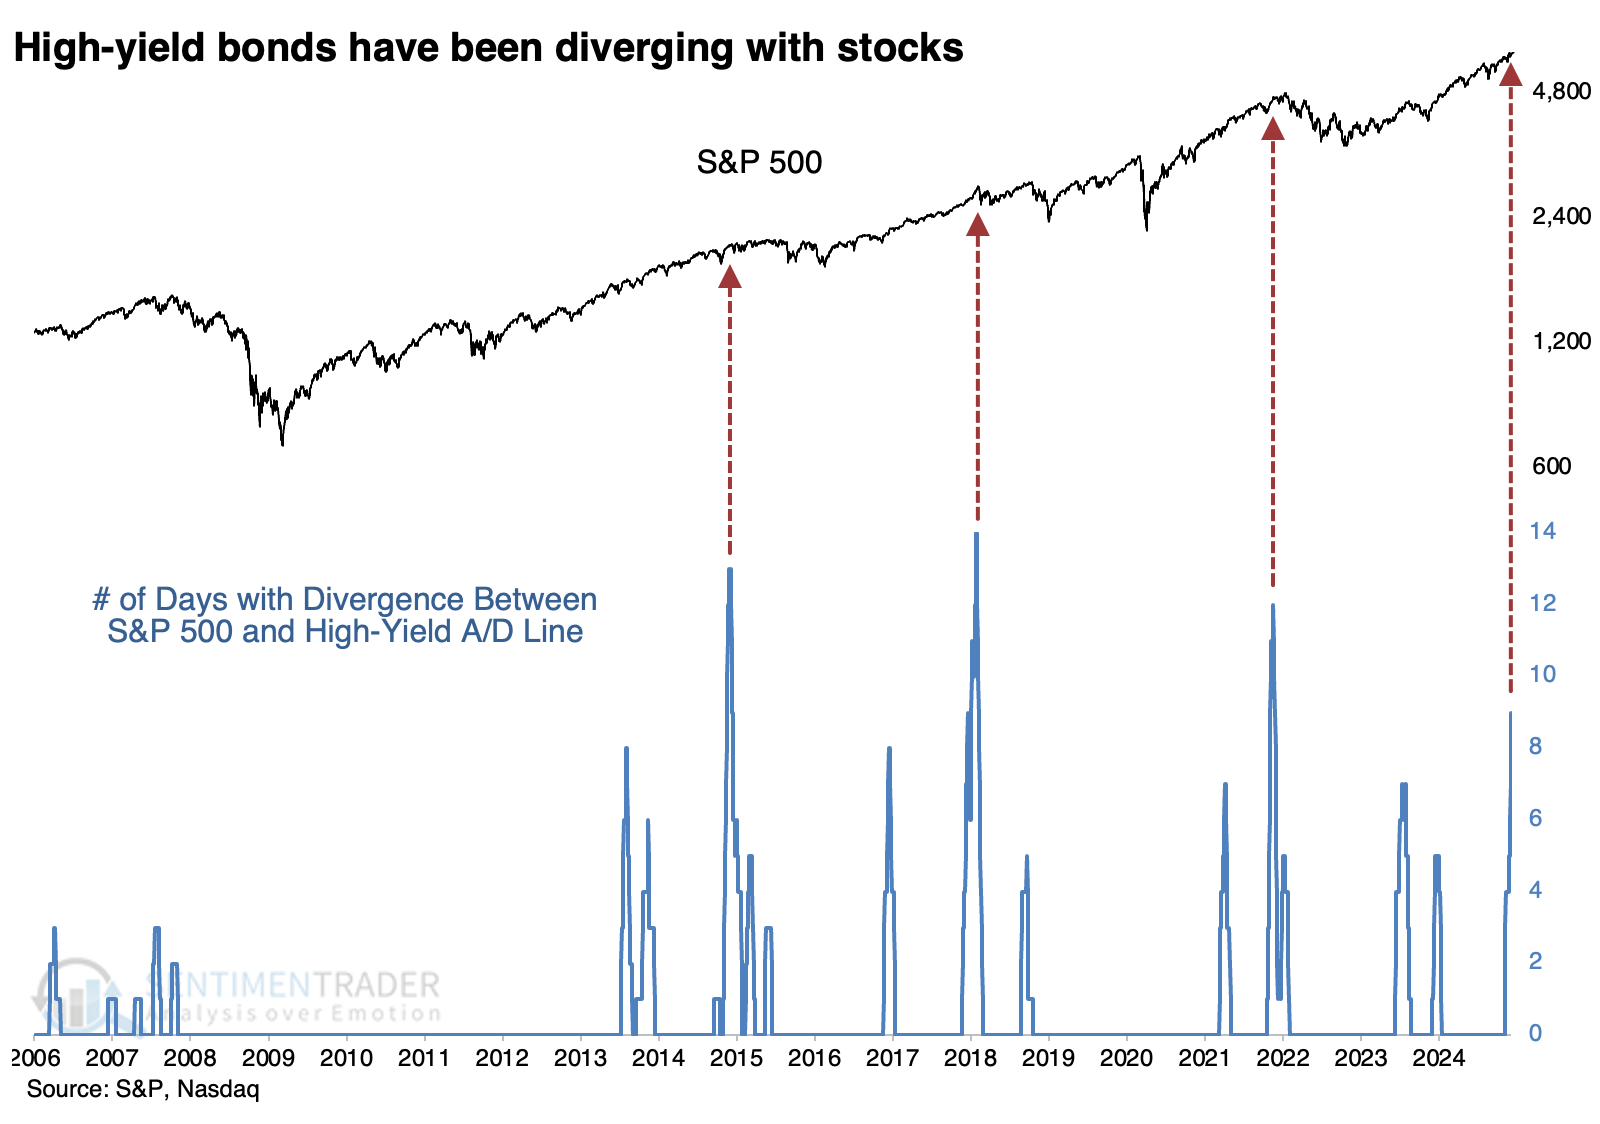
Divergences can be subjective, and their effective time frames tend to be inconsistent if they're effective at all.
To be more objective, let's look at clusters of divergences over a specific time period. Over the past month, the S&P has hit nine new highs on days when the HY A/D Line was at least 2% below its peak. This is one of the largest and longest divergences in nearly 20 years of available history.
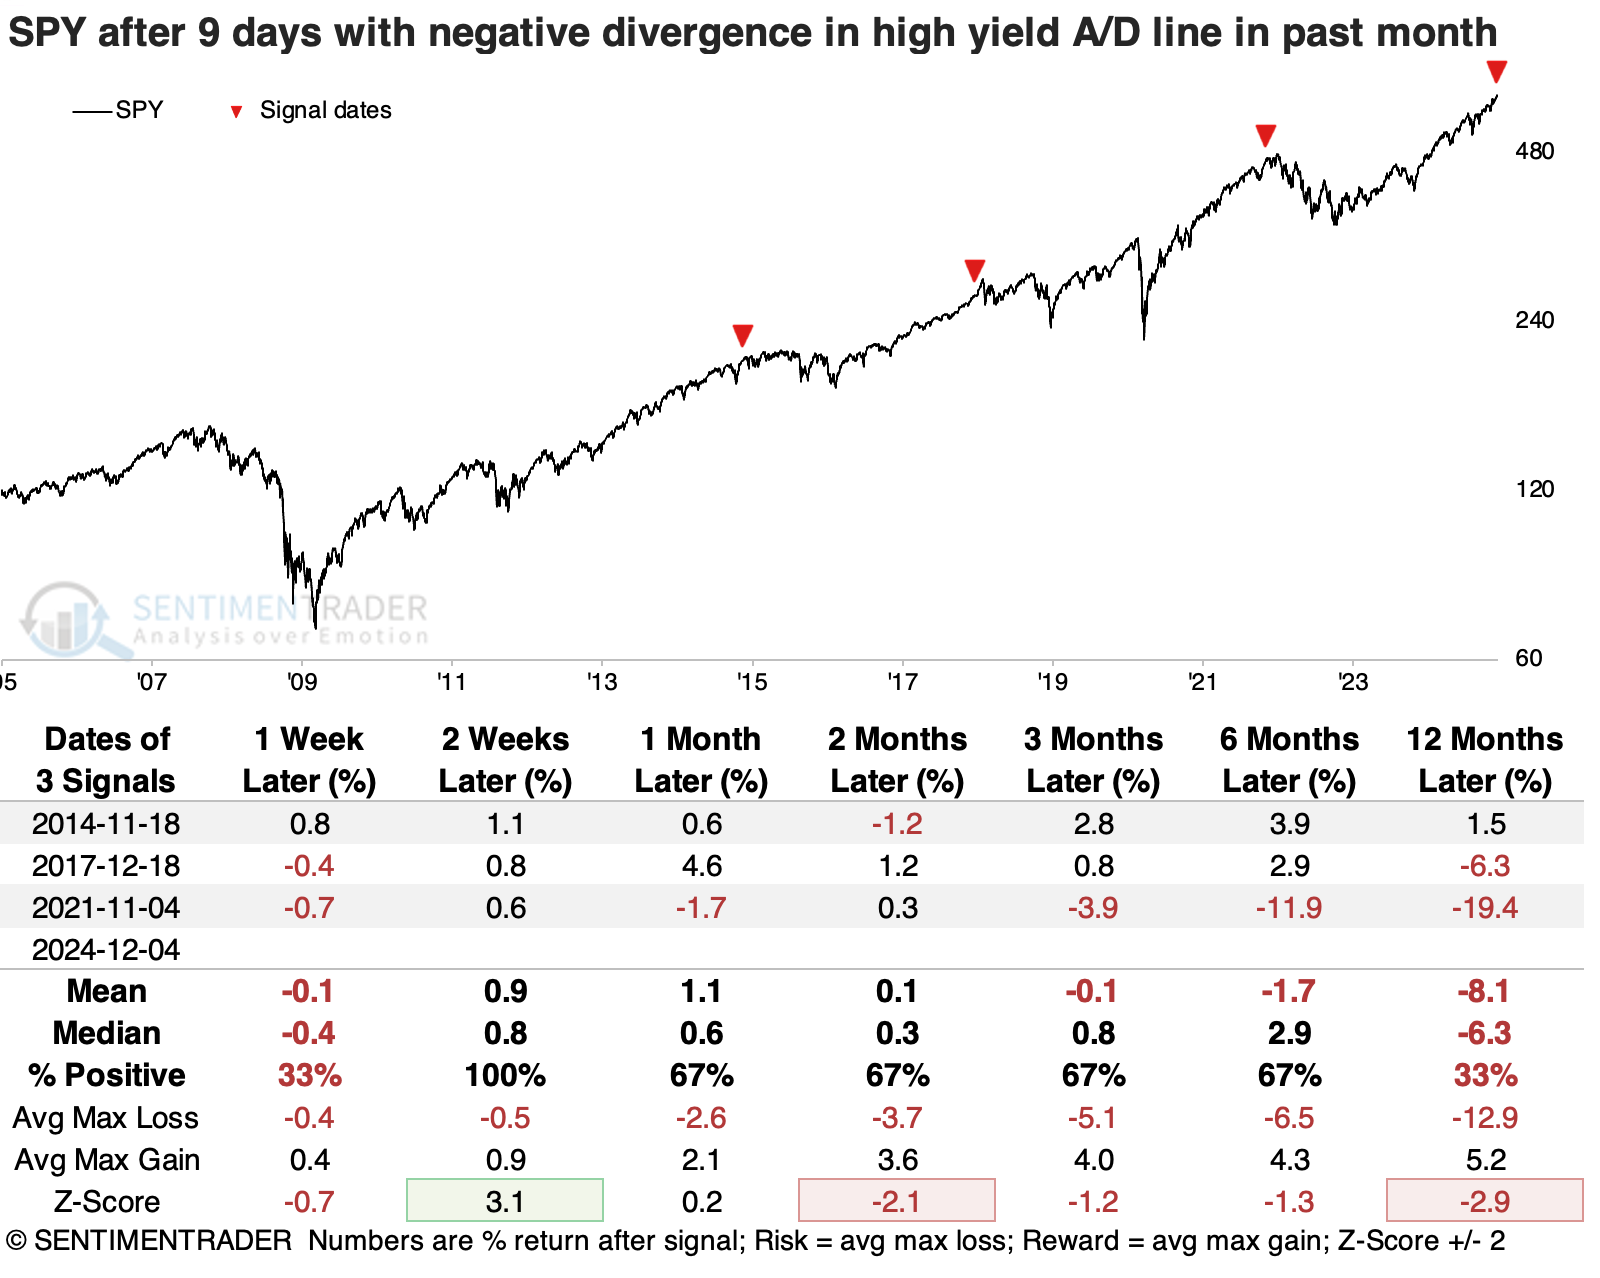
Below, we can see that the popular SPY fund struggled to hold gains when there were so many divergences. Yes, it's only a sample size of three, so there are the usual caveats about tiny sample sizes apply. The biggest takeaway from all three instances was limited upside, and any short-term gains that did occur evaporated during a subsequent correction.
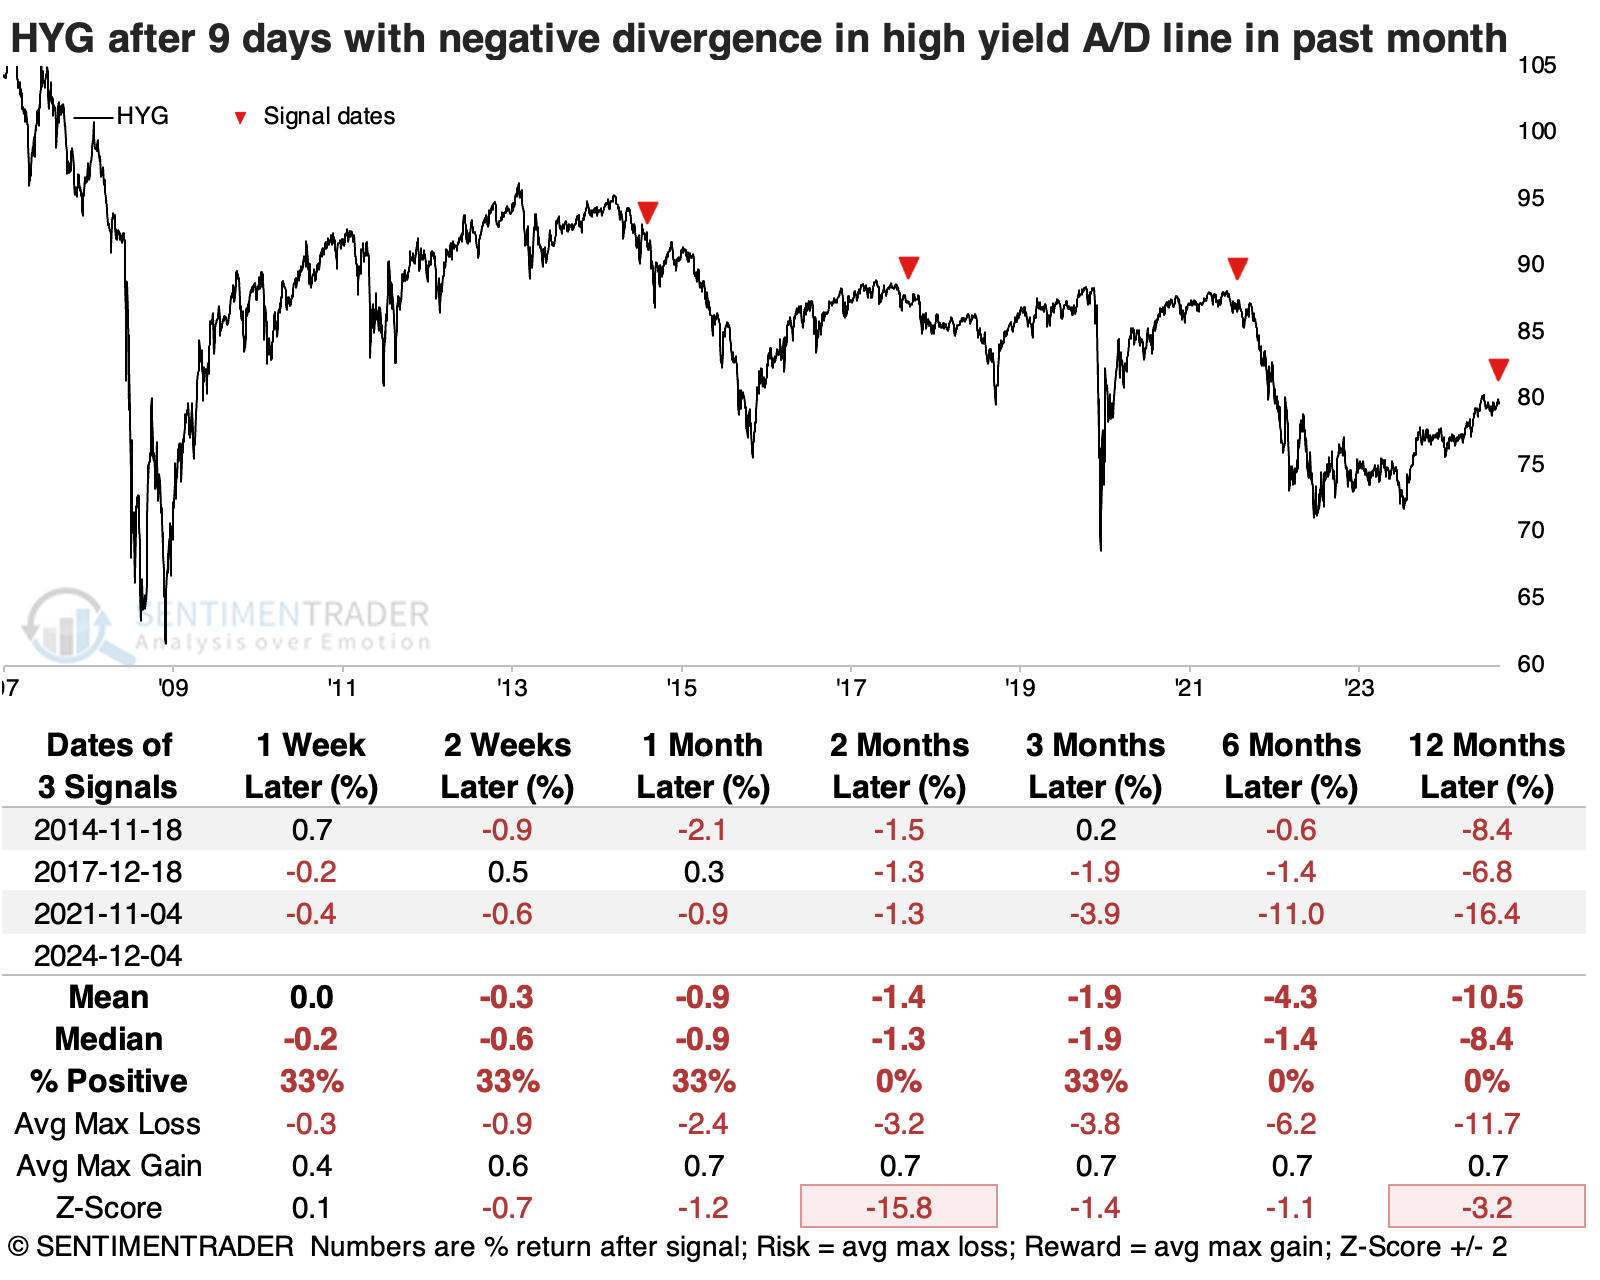
The leading ETF focused on high-yield bonds, HYG, suffered even worse returns. There was almost no upside after these signals, and HYG suffered some stinging losses in the months ahead.
Longer-term lackluster momentum
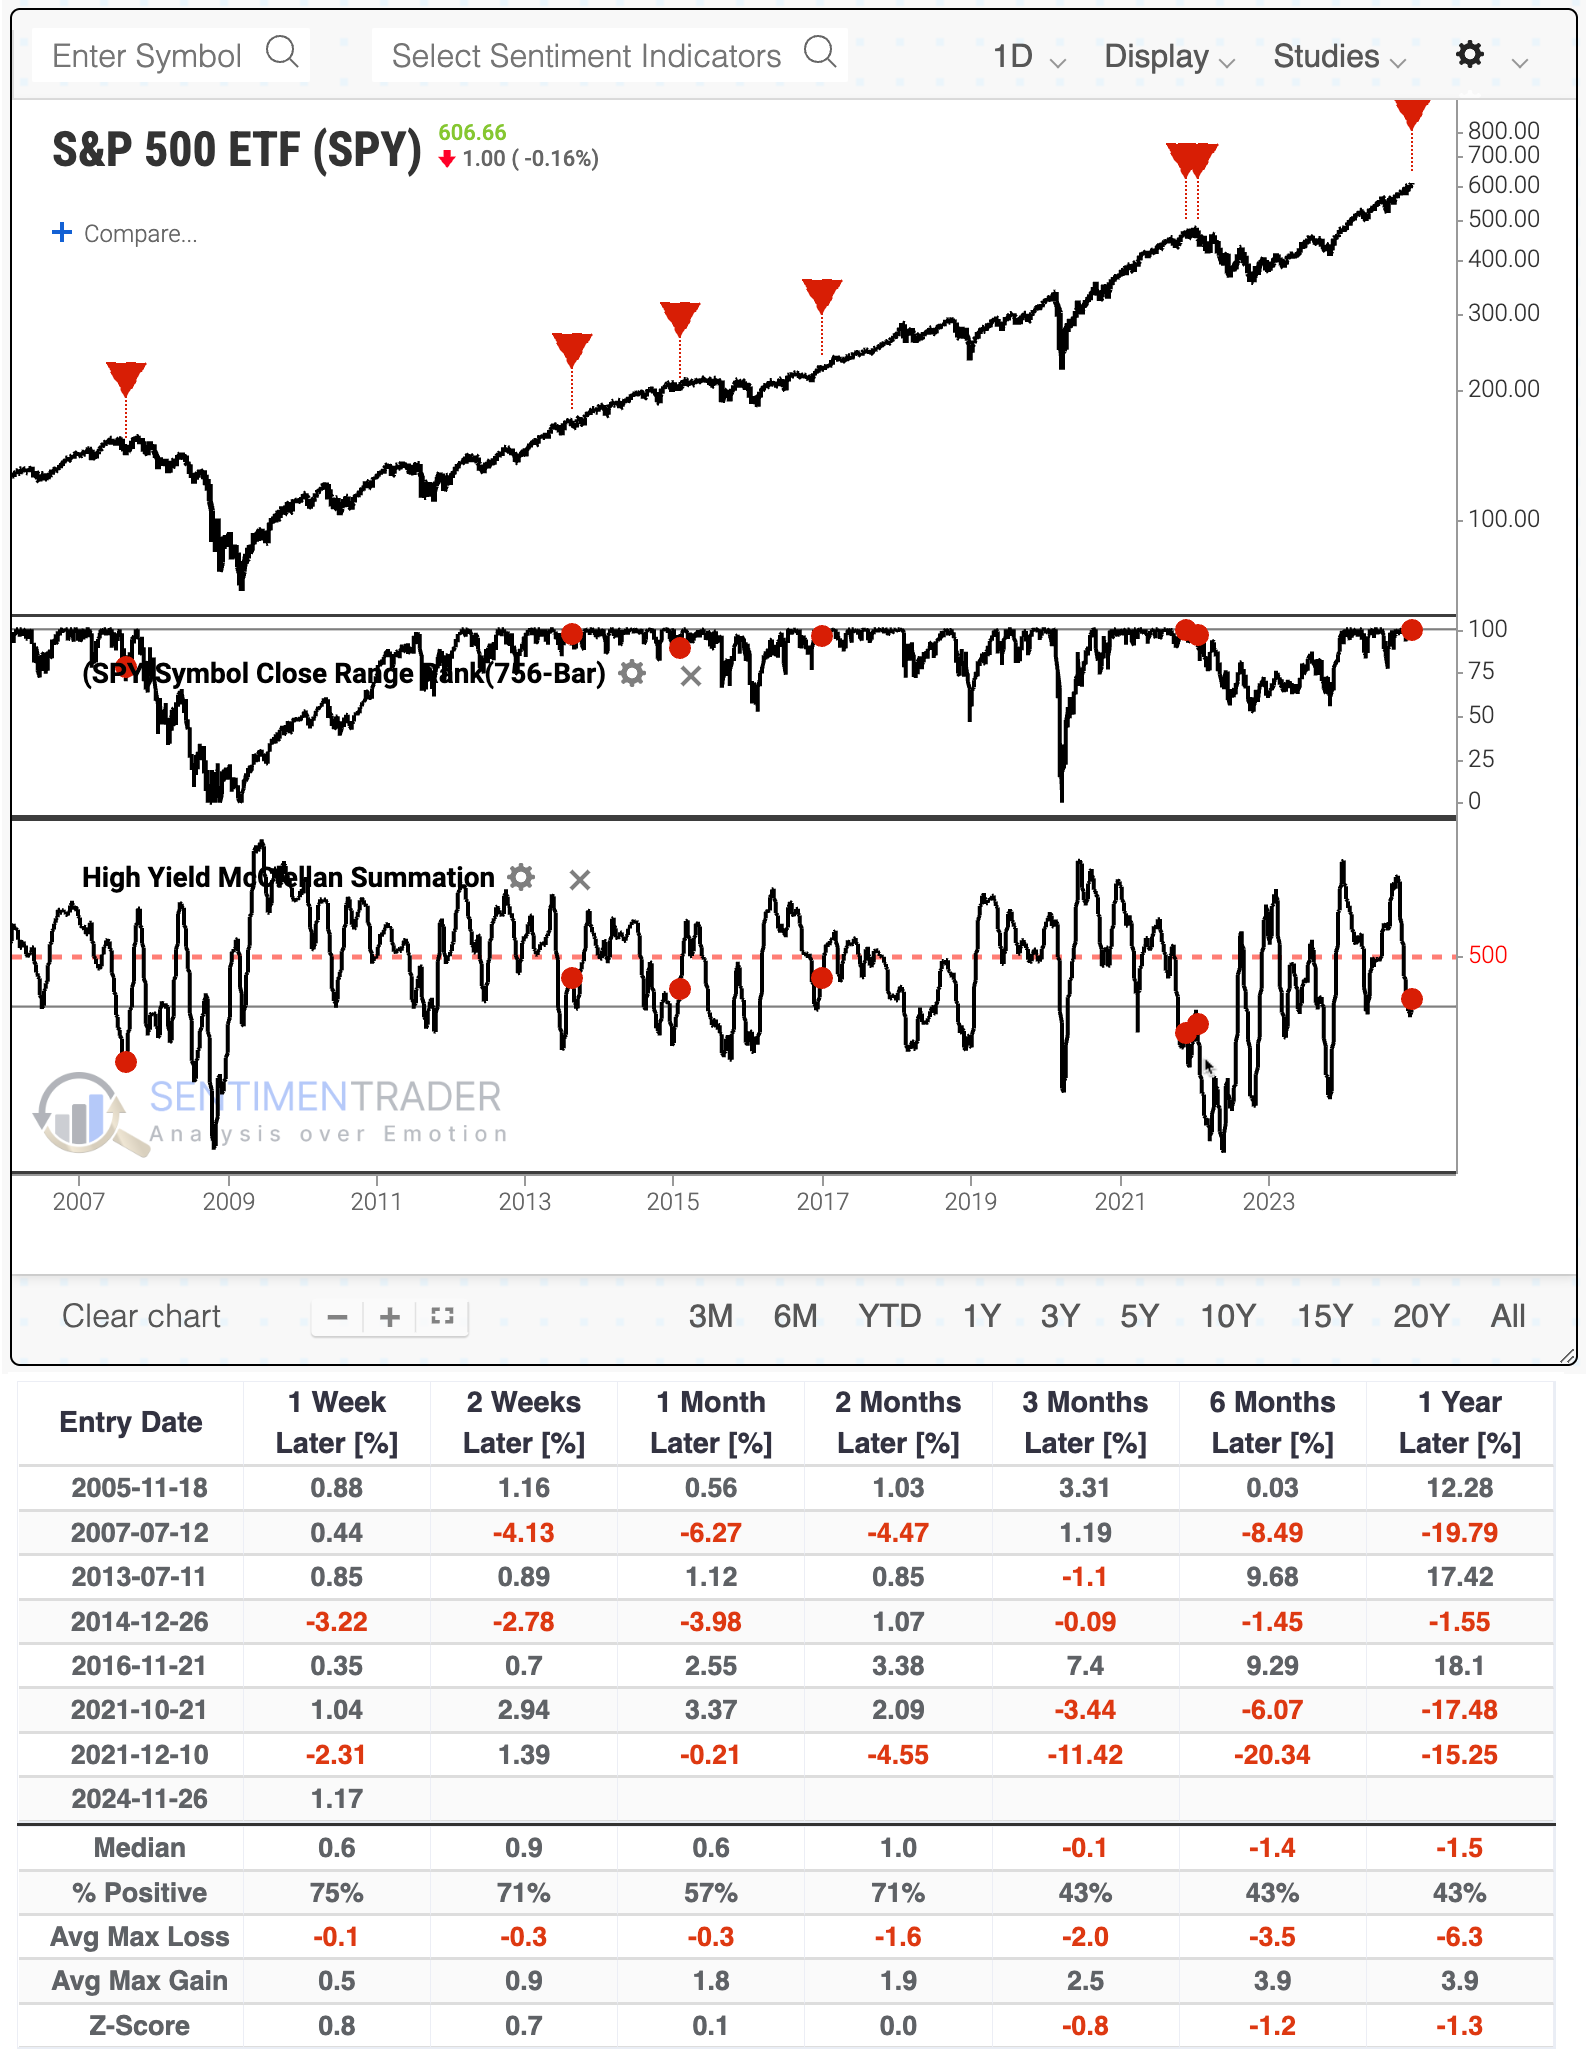
The lackluster participation among high-yield bonds kept its long-term McClellan Summation Index in negative territory even when the S&P 500 was making new highs. That's what happened at the peak in 2021. More recently, the Summation Index for high-yield bonds has dipped briefly below zero a few times, which were good times for stocks. The current dip bears watching for this reason.
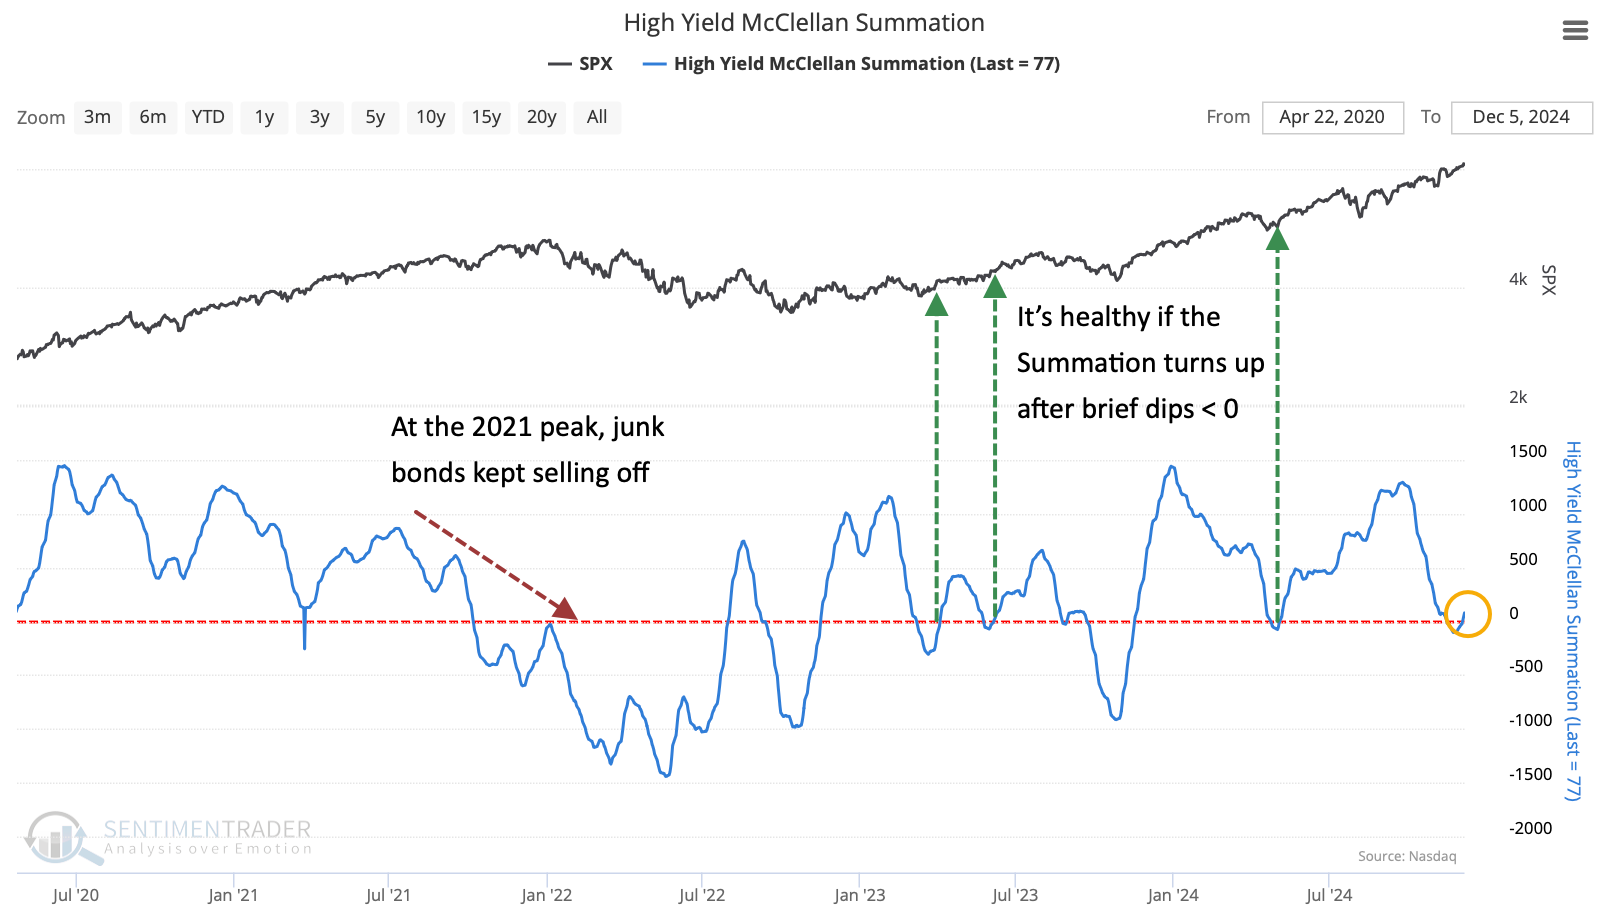
It's uncommon for the High-Yield McClellan Summation Index to be mired in negative territory on days when the S&P is at fresh highs. Below, we can see that the S&P suffered no ill effects over the next six months or so two times, while five times, it either stalled out or showed a negative return.
What the research tells us...
Other metrics for the high-yield bond market aren't sending out any caution signals. For example, there are still more bonds hitting 52-week highs than lows. The flip side of that is the 200-day average of that indicator is stretched and curling down, which has preceded other plateaus.
Most of what we follow regarding sentiment and positioning is stretched. That may be a decent sign to lighten exposure, but it's not for an outright bet against further gains. This behavior becomes more concerning when there is strong evidence of deterioration under the surface of the market, the main indices investors watch. The evidence there is limited for now and not a significant worry. We should keep our eye on high-yield bonds, however, as weakness there often precedes weakness in equity-specific breadth metrics.