
Some cyclical sector stocks that look poised for further upside

Key points:
- Trend and relative trend score indicators for several stocks are exhibiting bullish characteristics
- Today's report outlines how to use the trend score indicators for trading and investment ideas
- Trane Technologies, Howmet Aerospace, TransDigm Group, Zscaler, and Uber are a few to note
Trading and investing opportunities based on trend score indicators are beginning to broaden
In subscriber webinars, I've shared the two primary trend score methodologies I use to generate trading and investing ideas. The first is the trend score net change buy signal, which identifies trading opportunities when the trend score increases by at least four points over five days. This method is especially effective following corrections and bear markets, as it often provides early entries before broader improvement is reflected in the trend and relative trend scores. These signals serve as a precursor to reaching trend and relative trend scores of eight or higher, a threshold I use to confirm that a stock is trending up and demonstrating relative strength, making it a compelling candidate for a portfolio holding.
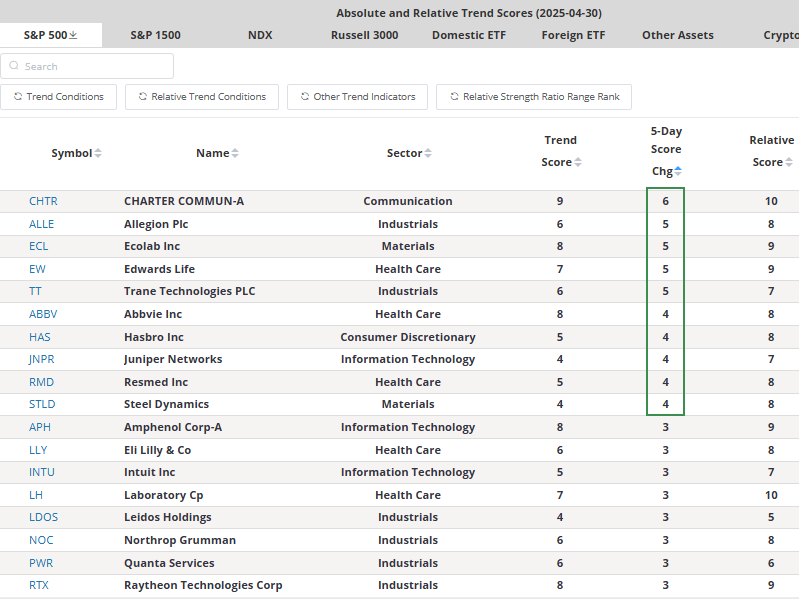
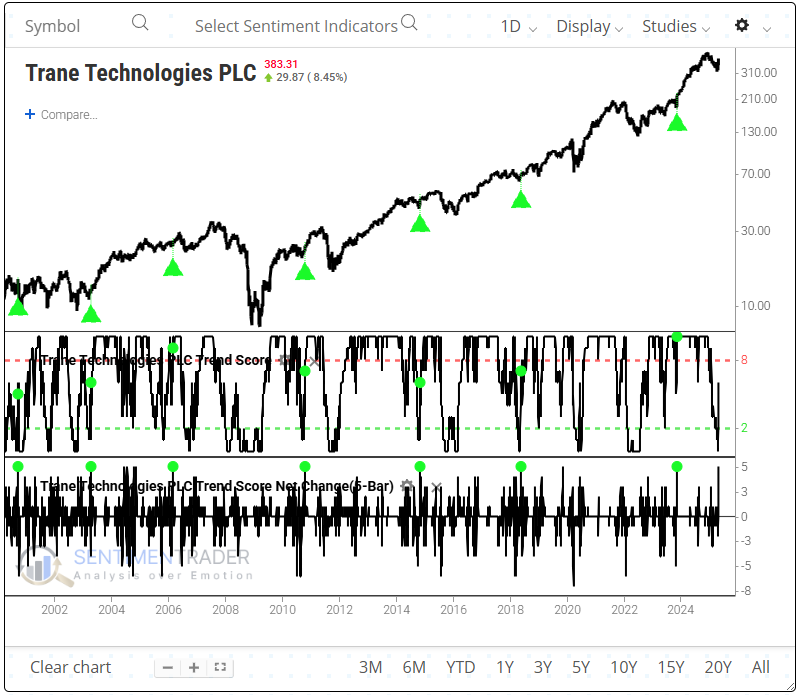
Because stocks have been in a corrective phase, I'm monitoring the 5-day net change indicator on the website for trading ideas. The following table sorts S&P 500 stocks by the 5-day net change. While several stocks show a net change of four or higher, one candidate that caught my eye is Trane Technologies (TT), as it is an industrial stock, one of the four cyclical sectors that display leadership qualities after corrections and bear markets.
Let's walk through how we can use the backtest engine to assess the outlook for Trane technologies (TT) following a trend score net change of five or higher.
A jump in the trend score accompanied by a relative breakout
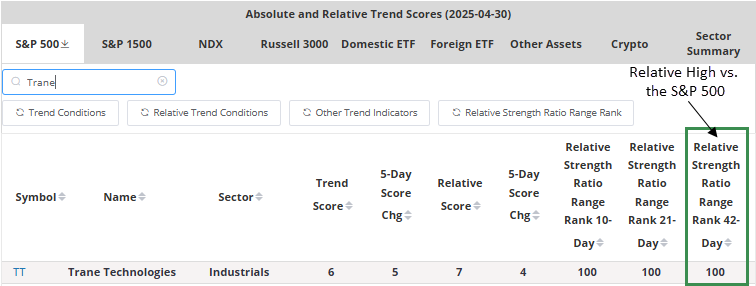
The Trend Score page has been enhanced with a new indicator: the Relative Strength Ratio Range Rank. It tracks where a stock's relative ratio against the S&P 500 falls within its historical range over periods from 10 to 126 days. A score of 100 marks a relative high; 0 marks a low. As shown in the table, Trane Technologies recently reached a relative high across multiple timeframes, most notably over a 42-day period.
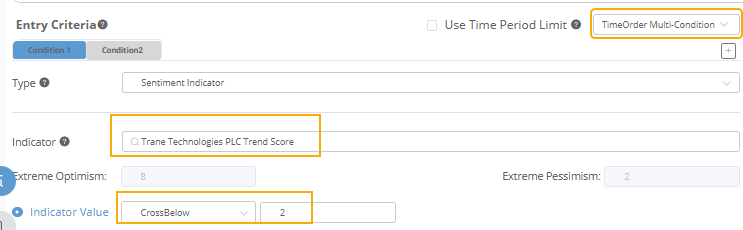
Here's how I created the trend score net change signal
Given that Trane Technologies' trend score declined to zero on April 21, I used the multi-condition function to implement a reset when the score was below 2, thereby replicating the current conditions.
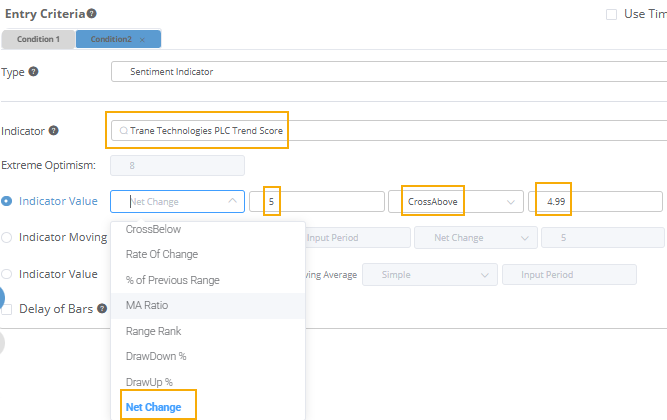
For the second condition, I adjusted the indicator to calculate the 5-day net change and set the trigger to a cross above 4.99, capturing any net score increase of five or more over that period.
Backtest engine analytics
As shown in the chart below, the backtest engine visualizes historical 5-day net change buy signals for Trane Technologies. The most recent signal occurred in November 2023, which was followed by a 29% rally over the next three months.
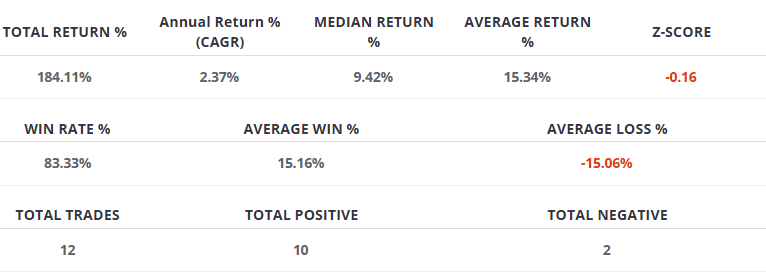
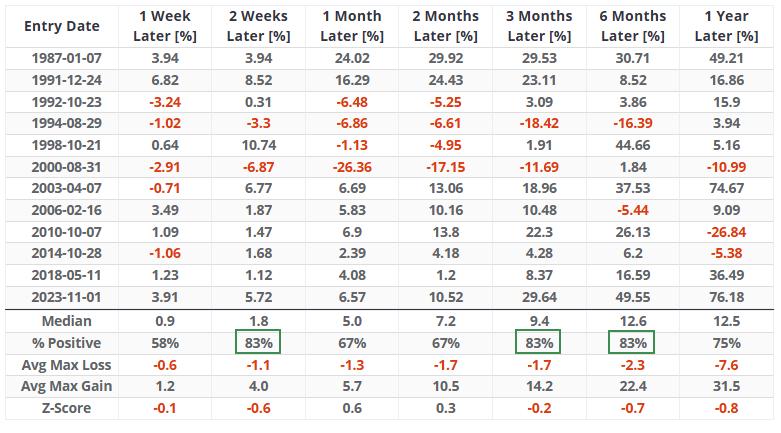
The signal has been triggered 12 times since 1987, resulting in an 83% win rate when held for a three-month period.
The multi-duration outcome table shows that multiple intervals achieved a three-month win rate of 83%, with a consistently bullish risk-reward skew across all time horizons based on average gains versus losses.
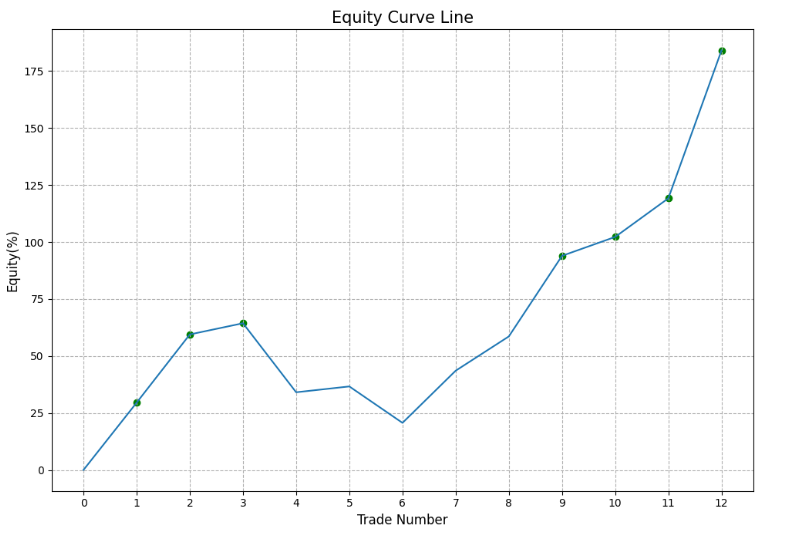
The system's equity curve demonstrates a gradual and consistent rise from the lower left to the upper right, underscoring its favorable performance.
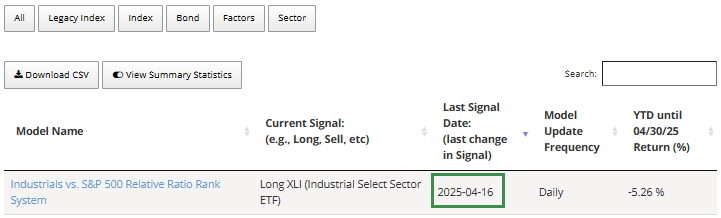
If you've been following our strategies page, you likely saw that the S&P 500 Industrials timing model flipped bullish on April 16. This indicates that the group shows relative strength compared to the broader market. As a result, investors exploring opportunities in this sector could benefit from a supportive backdrop.
Other trend score ideas
With the ability to export trend score data to Excel, subscribers can easily filter and combine it with other indicators of their choice, offering maximum flexibility in their analysis.
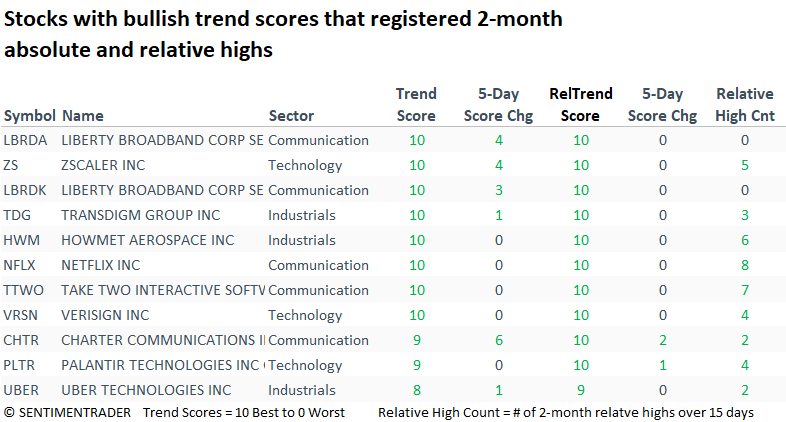
For example, I identified every stock within the Russell 1000 in the consumer discretionary, financial, industrial, technology, and communications services sectors that maintained a trend and relative trend score of 8 or higher. I then identified which ones registered a 2-month high, both absolute and relative terms, on Wednesday. The following table contains the output.
A chart is worth a thousand words
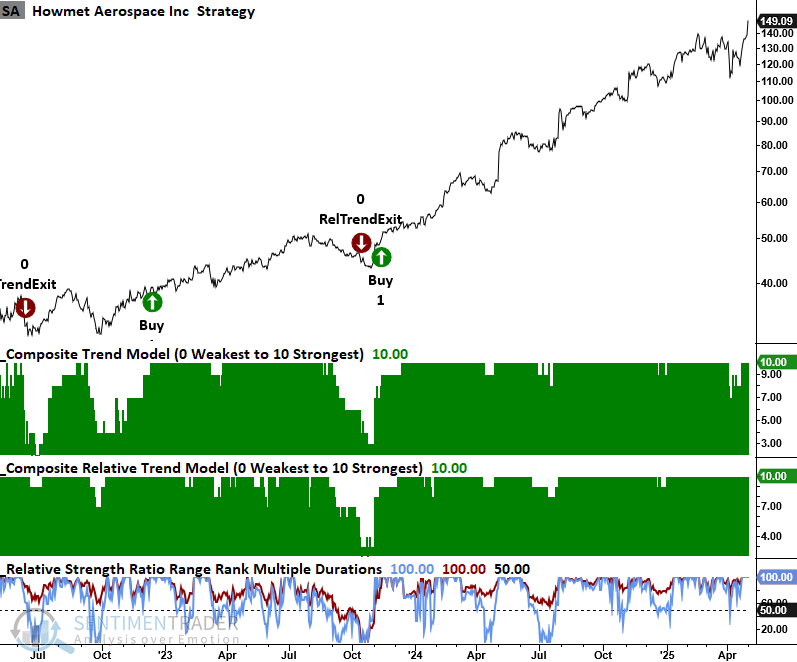
Howmet Aerospace (HWM) maintained its bullish trend and relative strength scores throughout the recent correction, surging to a new high this week. With six relative highs in the past 15 sessions, the stock remains strong compared to the broader market.
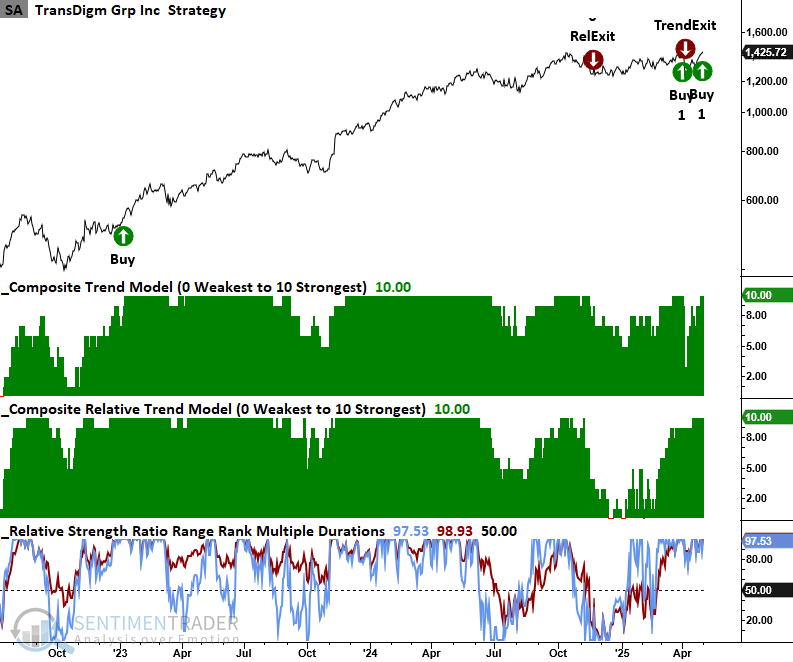
TransDigm Group (TDG), another aerospace company, triggered a new trend score buy signal on Wednesday and is now just 0.25% shy of a new high.
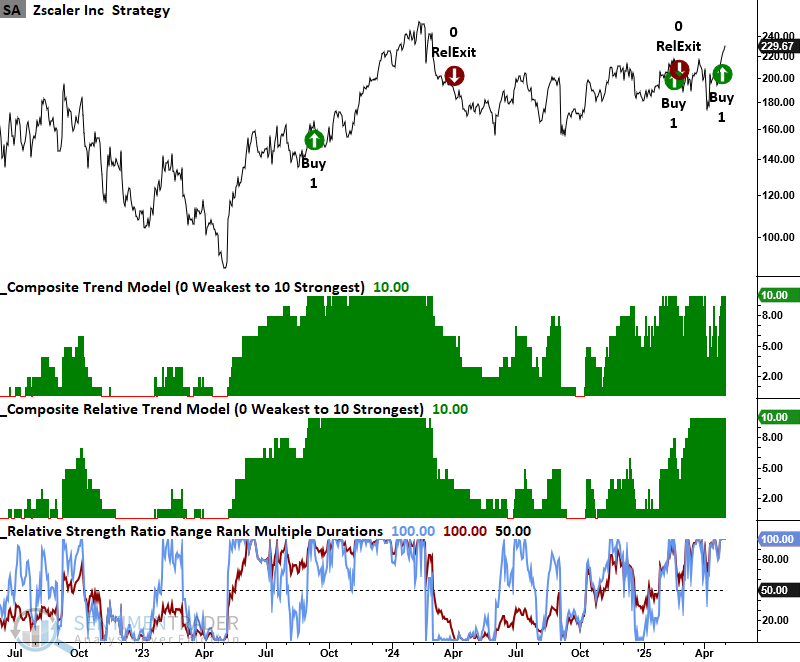
Zscaler, a cloud-based cybersecurity firm, triggered a new trend score buy signal on April 28, 2025, breaking out of a year-long consolidation and now appears set to challenge its 2024 high. I would also note that other cybersecurity stocks like CrowdStrike and Fortinet look solid.
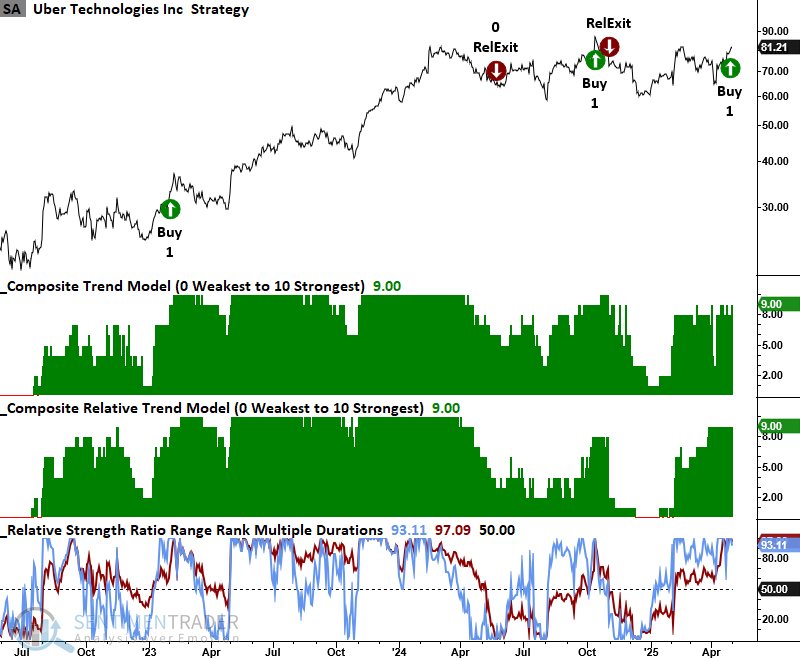
On April 29, 2025, Uber triggered a new trend score buy signal. There's an old saying among technicians: The bigger the base, the higher into space. With a year-long consolidation in place, Uber certainly fits the description.
There's a clear theme: aerospace and defense, as well as cybersecurity, a trend I suspect will remain sustainable for now.
What the research tells us...
As stocks extend their rally from a historically oversold condition, our proprietary trend score indicators are surfacing a growing number of opportunities for both traders and long-term investors. Subscribers can leverage the sortable tables and export tools on the trend score page to identify setups and test scenarios in the backtest engine, including the 5-day net change signal mentioned today. While I highlighted a few promising ideas, many more exist, particularly in cyclical sectors that often lead recoveries.