
Some cyclical clues for the U.S. Dollar

Key points
- The U.S. Dollar has been strong since bottoming in August
- January and February 2025 look favorable on a seasonal basis
- After that, investors may have good reason to be wary of the dollar as 2025 progresses
The U.S. Dollar was strong in 2024...but an important cycle is ending
The chart below shows that the U.S. Dollar (USD) has advanced since the end of 2020 and was particularly strong in 2024.
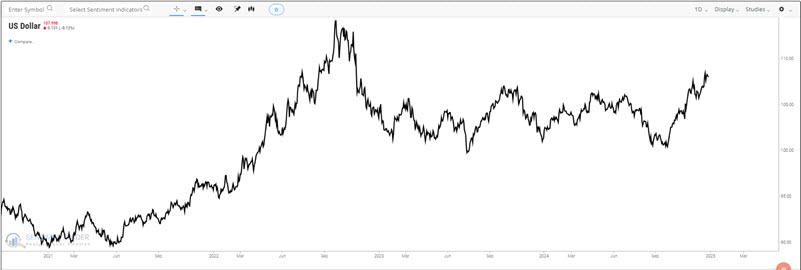
As 2025 dawns, the chart suggests the potential for continued strength during January and February.
While investors are encouraged to follow major trends, some cyclical concerns exist after February 2025.
The eight-year cycle is about to begin again. The first date in this sequence is 1968-12-31 (although our actual data file starts in 1970). 1969 through 1972 were labeled Years 1 through 4, and then 1973 through 1976 were labeled Years 5 through 8. The cycle then restarted in 1977 as Year 1.
The latest cycle ends at the close on 2024-12-31 as Year 8, and the next cycle begins in January 2025 as Year 1. Does any of this matter?
The table below displays the hypothetical $ gain/loss for U.S. Dollar futures during each half (Years 1 through 4 and separately Years 5 through 8) of the eight-year cycle since 1970.
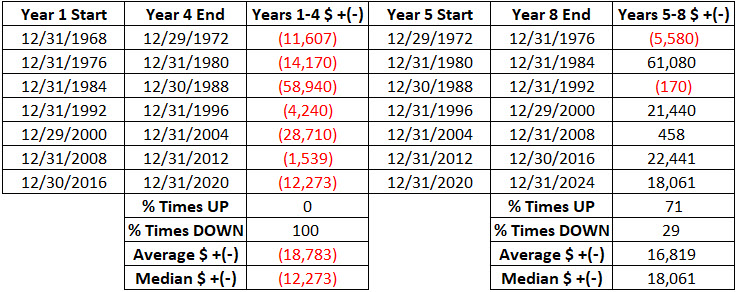
If history is a guide (and for the record, there is no guarantee that it will be), the USD should ultimately be expected to decline over the next four years.
The chart below displays the hypothetical $ gain/loss for U.S. Dollar futures (holding a long position) only during Years 1 through 4 in the table above. Note that 2025 through 2028 is the next "Year 1 through 4" in this sequence.
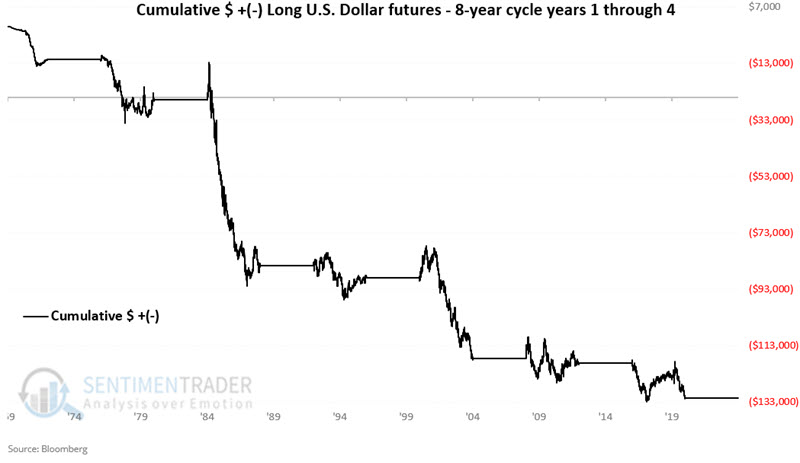
As we are now entering Year 1 of the next eight-year cycle, the results in the chart above serve as a potential warning about being routinely bullish on the USD in the years ahead.
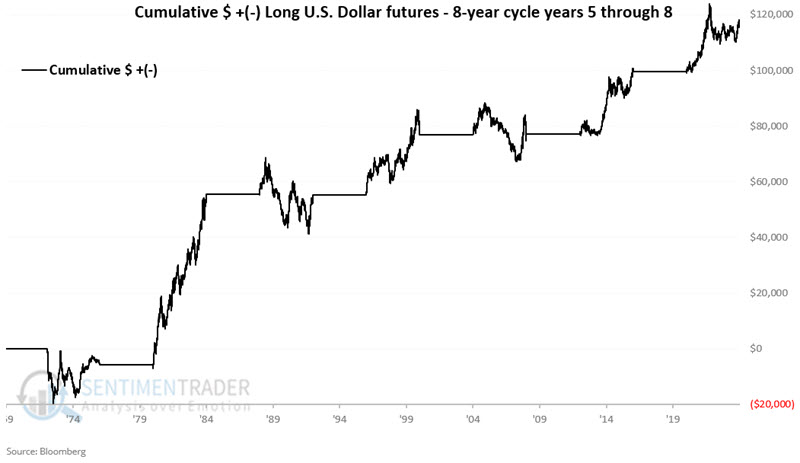
Conversely, the chart below displays the hypothetical $ gain/loss for U.S. Dollar futures (holding a long position) only during Years 5 through 8 in the table above (through 2024-12-27).
A closer look at Year 1 of the eight-year cycle
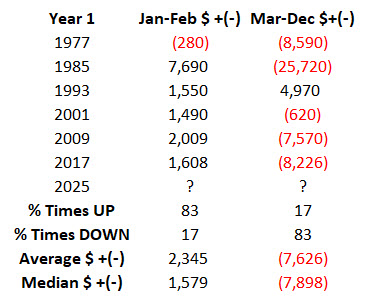
Years #1 include 1977, 1985, 1993, 2001, 2009, 2017 and 2025. The table below displays the cumulative hypothetical $ gain/loss from holding a long position in U.S. Dollar futures only during these years, with returns broken out by month.
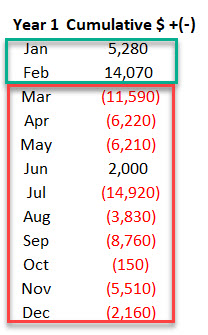
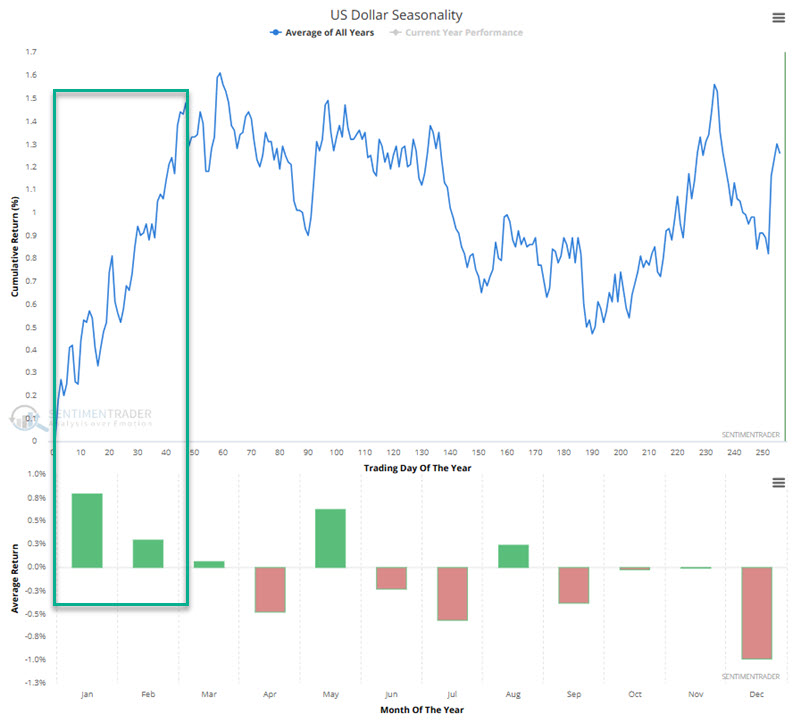
The obvious thing to note is the strength during January and February and the weakness during the rest of the year. It is worth noting that the sample size is only six years. Still, the contrast is compelling.
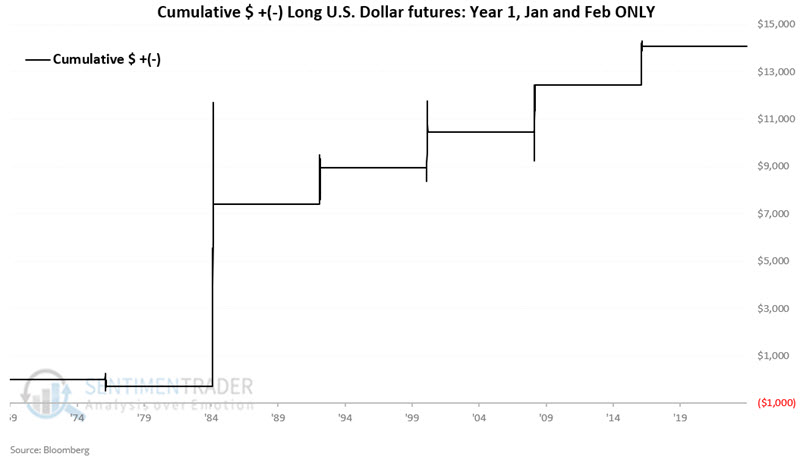
The chart below displays the hypothetical $ gain/loss for U.S. Dollar futures (holding a long position) only during January and February of the previous Years 1 listed above.
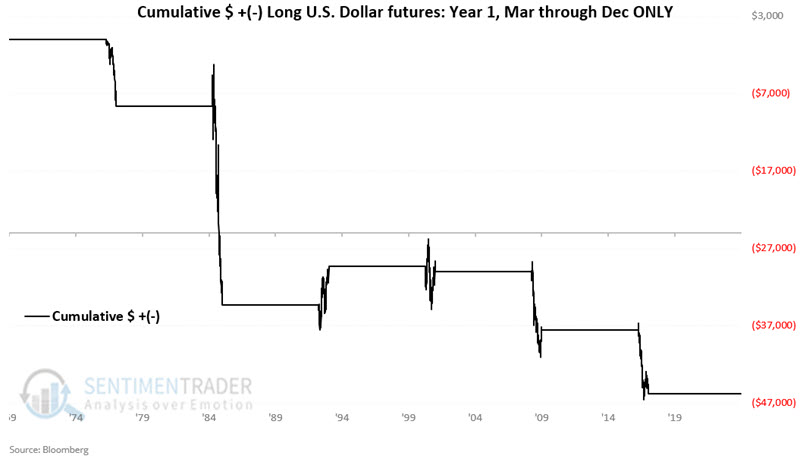
Contrast the equity curve in the chart above to the one below, which displays the hypothetical $ gain/loss for U.S. Dollar futures (holding a long position) only from March through December of Year 1.
The Year 1 results are summarized in the table below.
What the research tells us…
So, does the information above guarantee that U.S. Dollar futures will move higher during January-February 2025 and then decline for the rest of 2025? Not at all. As always, seasonal patterns reflect what has happened in the past and not a roadmap to the future. That said, dollar traders would be wise to continue to follow the bullish trend as long as it lasts, particularly in early 2025. However, if weakness develops as 2025 progresses, the above results strongly suggest that investors "abandon ship" and/or look to play the short side of the U.S. Dollar.