
Some contrarian signals for metals

Key points
- Metals markets and gold stocks have been strong performers in the past year
- We cannot predict when this period of strong performance will end, but some warning signs have finally begun to flash
- Signals from gold stock breadth and sentiment, and platinum sentiment suggest the potential for a more challenging environment for metals traders - and particularly gold stock traders - going forward
GDX favorable breadth reaches an extreme
The chart below highlights all dates when the 10-day average of the GDX Breadth (% > 200 Day Avg) indicator was at 94% or above.
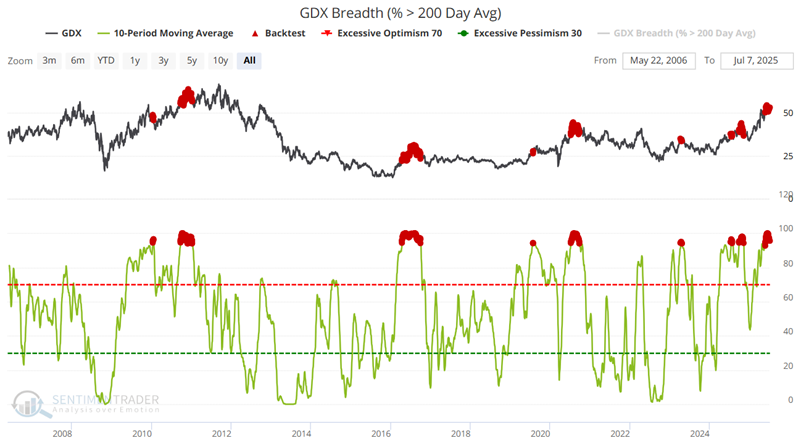
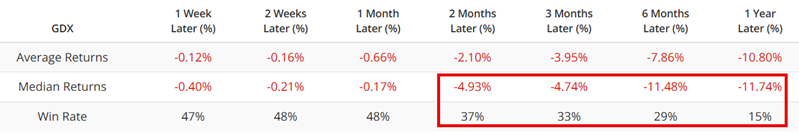
The table below summarizes the performance of the VanEck Gold Miners ETF (GDX) following the signals highlighted in the chart above.
GDX unfavorable breadth also reaches an extreme
The chart below highlights all dates when the 20-day average of the GDX % in Bear Market indicator was below 13%.
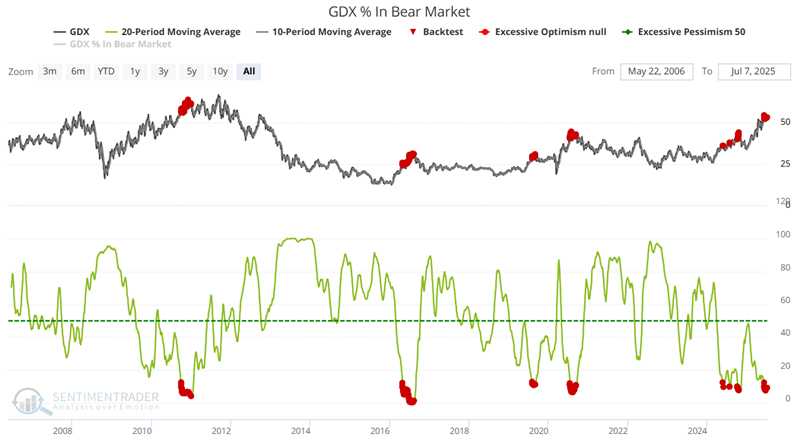
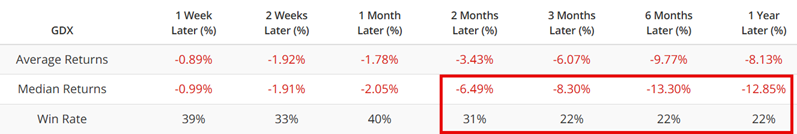
The table below summarizes the performance of the VanEck Gold Miners ETF (GDX) following the signals highlighted in the chart above.
GDX sentiment also recently peaked at a worrisome extreme
The chart below highlights each date when the 100-day average of the GDX Optix indicator crossed below 60%. Note that the sample size is extremely small, so it is dangerous to draw any conclusions. However, given the indicator readings discussed above, the recent extreme action of GDX Optix appears to be somewhat more relevant.
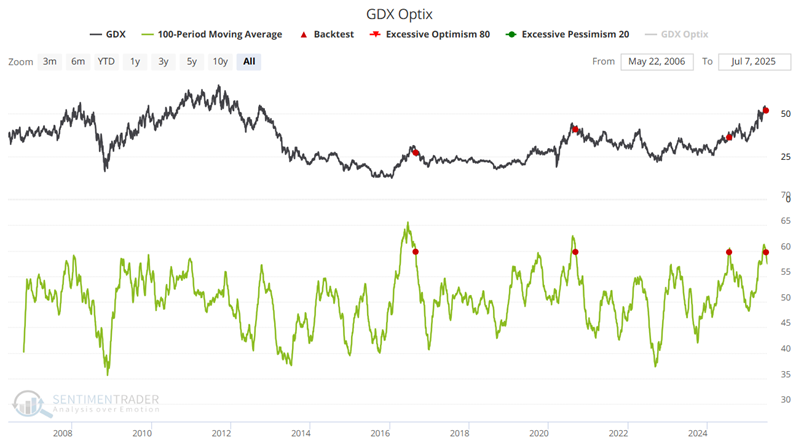
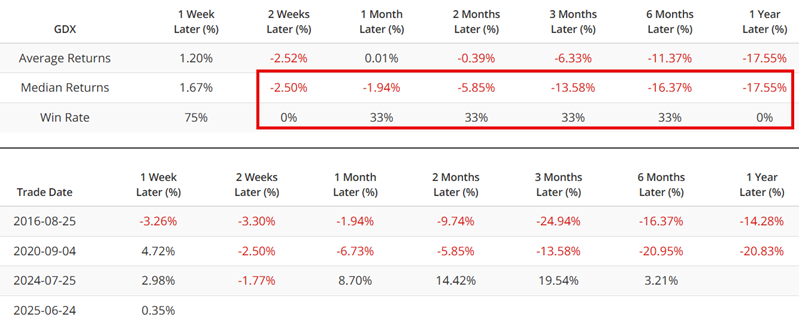
The table below summarizes the performance of the VanEck Gold Miners ETF (GDX) following the signals highlighted in the chart above.
A warning sign after a sharp run-up in Platinum
The chart below shows that the ABRDN Physical Platinum Shares ETF (PPLT) recently enjoyed an explosive advance.
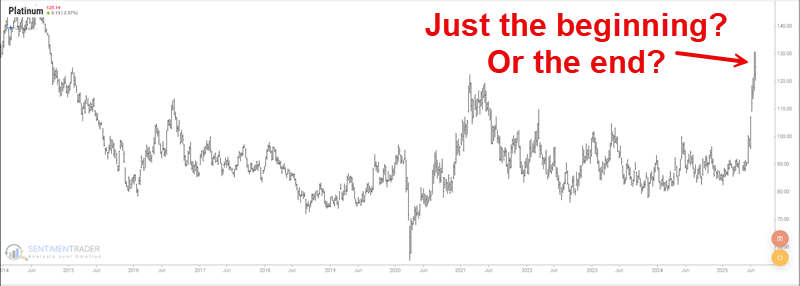
Historically, trying to fade this type of "rocket launch" advance in the metals market is fraught with peril, as these types of advances can run much further than one would rationally expect. Still, in the interest of objectivity, the chart below highlights all dates when the 10-day moving average of the PPLT Optix indicator crossed below 77.7%. The most recent signal occurred on 2025-07-03.
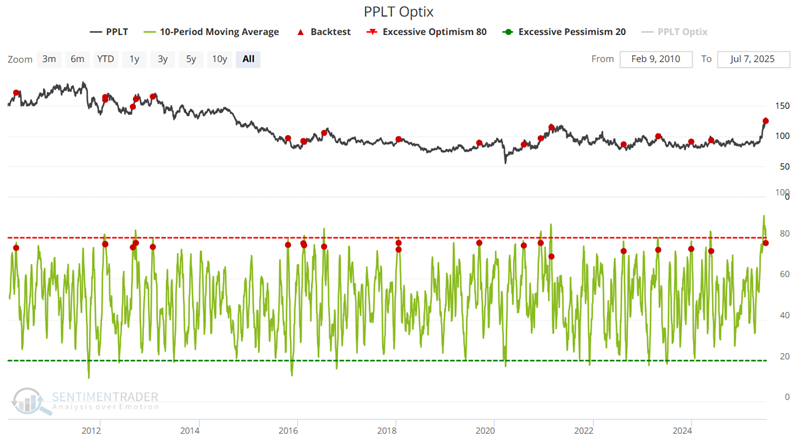
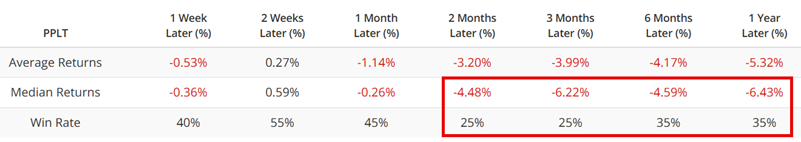
The table below summarizes subsequent PPLT performance.
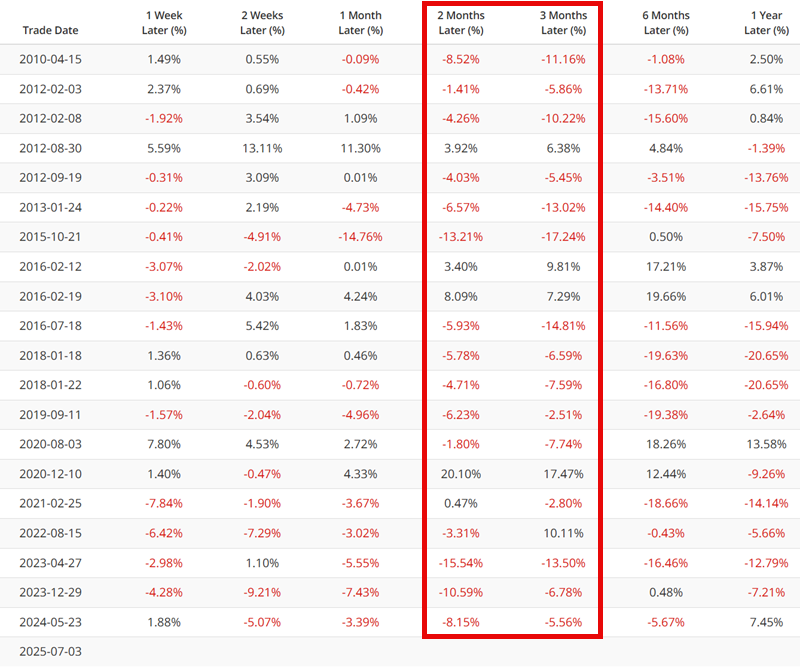
The table below highlights signal-by-signal results.
So, is the platinum rally dead? Not at all. But this particular indicator suggests caution going forward.
What the research tells us…
Gold, silver, copper, and gold stocks are all at or near multi-year (or all-time) highs. In addition, platinum recently "joined the party" with a sharp advance. Attempting to "pick the top" in an environment like this is fraught with financial peril. Historically, metals markets and gold stocks have a choppy history, but "when they run, they really run." Thus, attempting to sell short into the teeth of a significant advance is a risky proposition. Nevertheless, breadth and sentiment signals like the ones highlighted above often presage the impending end of a trend, or at least a significant correction, or period of consolidation and underperformance. If metals (and gold stocks) continue to make new highs, I would be hesitant to fade the trend. However, if these markets (and gold stocks) hesitate, and/or fail to break through, or break through and then quickly reverse, the data presented above suggests that things could become much more challenging going forward.