
Some big picture indicators are still on the bearish side of the ledger

Key points:
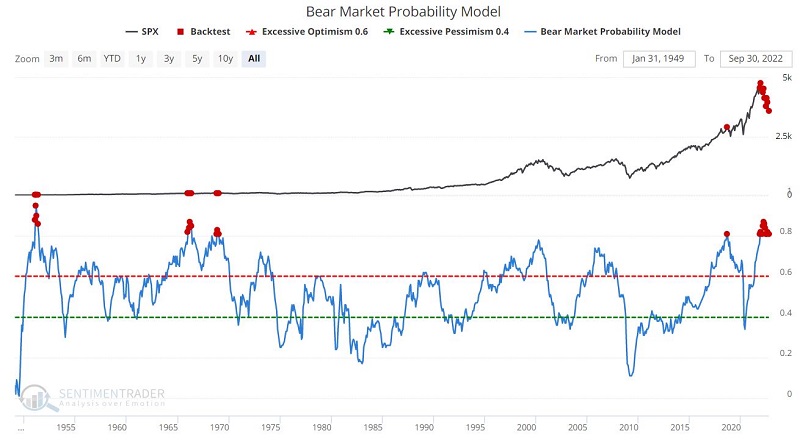
- The Bear Market Probability model remains in dangerously bearish territory, despite the market decline
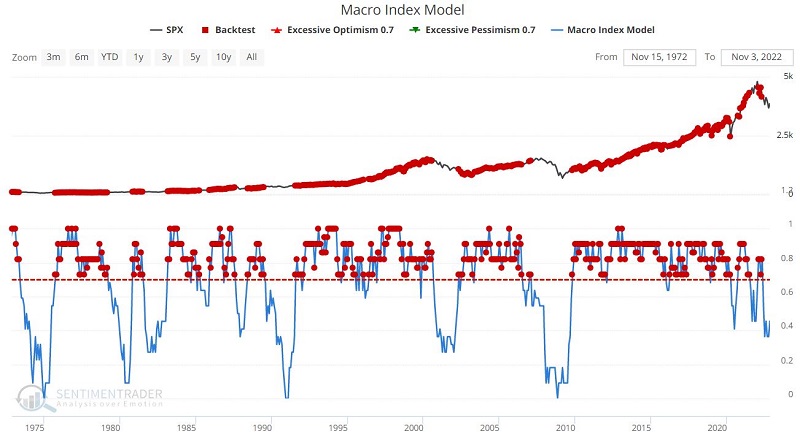
- Our Macro Index Model continues to warn of a high probability of an impending economic recession
- The combined Bear Market Probability - Macro Index Model spread remains at its second-highest reading ever
The Bear Market Probability model is in dangerous territory
What has been clear for over a year is that the U.S. economy is facing headwinds. They haven't abated much.
Thanks to historically low unemployment rates, a negative yield curve, and high inflation, some of our macro models have been sounding warnings since last fall. Despite the severe decline in stock prices, the models haven't moved much.
The Bear Market Probability model assesses the likelihood of bear market conditions. As you can see in the chart below, this indicator remains very near the high end of the historical range at 0.81 (i.e., an 81% probability of bear market conditions).
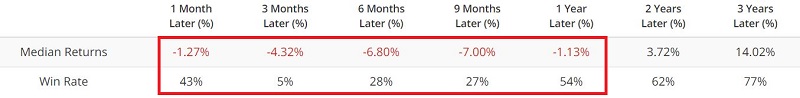
The chart and table below highlight those rare occasions when the indicator stood at 0.80 or higher. Results have typically been unfavorable in the three to twelve months after 0.80+ readings.
The Macro Index Model remains unfavorable for the economy
Our Macro Index Model (MIM) is more of an economic indicator than a stock market indicator, although it does a pretty good job in that role, as chronicled here.
Two things to know about MIM:
- Readings above 70 are considered favorable for the economy and stocks, and readings below 70 are considered unfavorable
- Inverting the model gives a rough estimate of the probability of a recession (1 - latest reading of 0.364 times 100 = 63.6% probability of a recession).
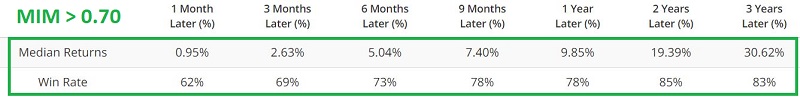
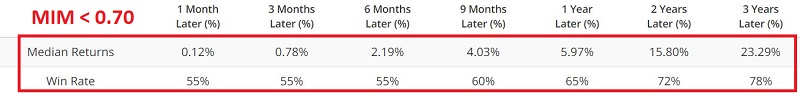
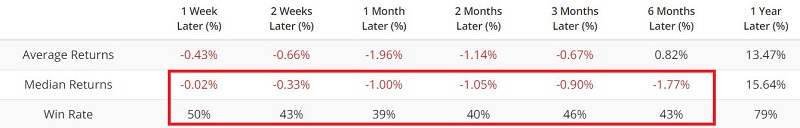
The figure below displays S&P 500 results following readings above 0.70 versus below 0.70. Note that Median Returns and Win Rates are higher across the board when the MIM is greater than 0.70. The current reading is 0.46.
Bear Market - Macro Index Model spread remains worryingly high
Last year Jason introduced an indicator that combines the two indicators detailed above. High readings are considered unfavorable for stocks and vice versa. The chart and table below highlight those times when the indicator stood at 30 or higher.
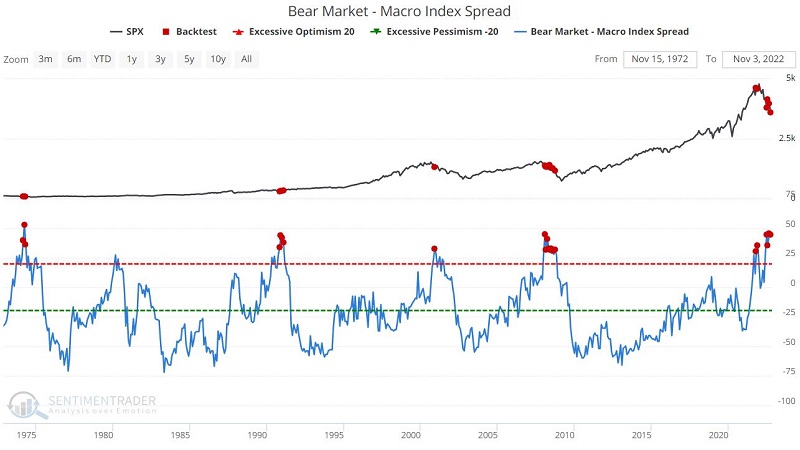
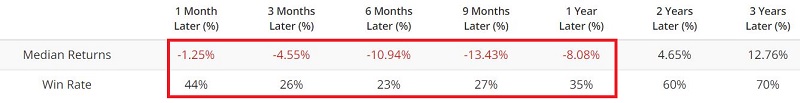
Despite the steep market decline in 2022, this indicator remains nearest its highest-ever reading. As you can see in the table above, readings above 30 have witnessed negative returns on average in the following year. The current reading is a sobering reminder that downside risk still exists and that waiting for some confirmation before turning bullish may be wise.
For details on a mechanical approach to using this indicator, see here. Note that the S&P 500 Index is down over -20% since the sell signal generated by this method on 8/31/2021.
A bond market indicator that is negative for stocks
Our Bond Market Risk Levels indicator focuses on the bond market. Nevertheless, because of the tight relationship between interest rates and stock prices, it turns out that this indicator can also be helpful to stock market investors.
The chart and table below display performance for the S&P 500 Index following Bond Risk Levels readings equal to 1.
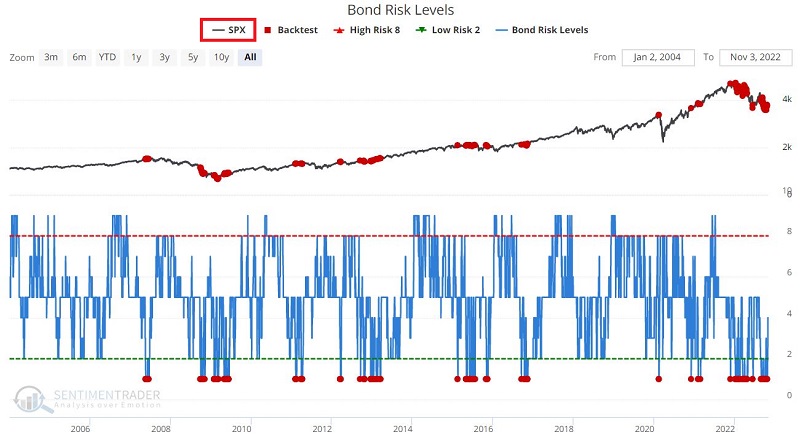
As the numbers above illustrate, the stock market tends to generate very subpar results when the Bond Risk Levels model is unfavorable.
What the research tells us…
In recent weeks we have seen a wide variety of sentiment and breadth indicators flash favorable signals for the stock market. Likewise, seasonality is about to line up very favorably for stocks in the months ahead. The possibility for a meaningful, tradable rally exists. The question for investors and traders with cash on hand is when to jump in. The results illustrated above suggest that investors be patient and wait for confirmation of the resumption of an uptrend before taking the plunge.