Products
SentimenTrader Trading Tools
‍
Backtest Engine
My Trading Toolkit
Correlation Analysis
Seasonality
Market Prediction
Indicators & Data API
‍
Proprietary Indicators & Charts
Market Data API
Strategies & Scanner
‍
50+ Trading Strategies
Smart Stock Scanner
Smart Option Scanner
Research Reports
‍
Research Solutions
Reports Library
Free Resources
Simple Backtest Calculator
Simple Seasonality Calculator
The Kelly Criterion Calculator
Sentiment Geo Map
Public Research Reports
Education
Sentiment Indicators
Technical Indicators
Pricing
Company
About
In the News
Testimonials
Client Success Stories
Contact
Log inLoginSign up
< BACK TO ALL REPORTS

Soaring gas prices have triggered a record divergence in sentiment

Jason Goepfert
2022-03-30
Two respected surveys of consumer sentiment are showing drastically different opinions. The dollar is now entering its seasonal weak spot.

A sentiment divergence

The latest monthly surveys of consumer sentiment are out, and they're...not good. The Consumer Sentiment survey from the University of Michigan was particularly despondent, with the 11th-lowest reading since 1978. The only lower readings during the past 40 years were during the depths of the global financial crisis.

Other surveys aren't quite so drastic, including the Conference Board survey of Consumer Confidence. But the two surveys have some differences, most notably among the questions they ask.

US Bancorp Asset Management gets to the gist of it:

"The Consumer Confidence questions place a greater emphasis on employment and labor market conditions while the Consumer Sentiment survey emphasizes individual household finances. This drives the impression Consumer Confidence more generally reflects consumer feelings towards the overall economy while Consumer Sentiment reflects consumer perceptions of their own personal circumstances."

A simple web search will turn up dozens of in-depth analyses of the two surveys, including academic studies of the inputs important to each of them. It typically boils down to gasoline - consumers in the U. of Michigan survey tend to be more influenced by high gas prices. Prices have been rising quickly, so sentiment has declined.

The spread between sentiment in the surveys just hit a record low. That (roughly) suggests that consumers have never been more pessimistic about their personal situation relative to the broader economy. And, when this spread has been extreme, it has had an impact on forward returns in the S&P 500.

Spread between consumer sentiment surveys

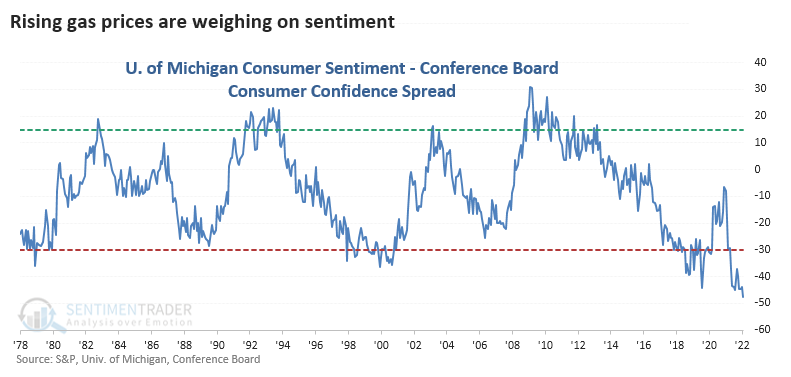
The S&P returned +17.1% p.a. when the spread was extremely positive, but a woeful -8.0% p.a. when it was extremely negative.

Among sectors and factors, the defensive Utilities and Health Care sectors showed the best annualized returns after extremely negative readings. Commodities also tended to do well.

The dollar faces a headwind from the calendar

Despite low rates, high debt, and competition from Bitcoin, etc., the US Dollar has performed very well since bottoming in May 2021. But Jay pointed out that the dollar is now entering a period of typical seasonal weakness.

The chart below displays the annual seasonal trend for the US Dollar. Note the large unfavorable period over much of the year - starting now.

U.S. dollar seasonality turns negative

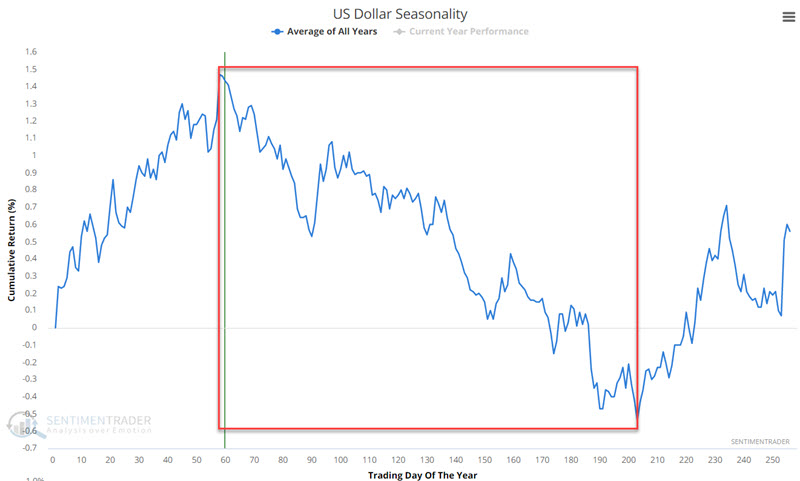
Over the past 37 years, this period showed a positive return 14 times and a negative one 23 times, with a much larger median loss than gain.

PRODUCTS
SentimenTrader
Trading Tools
Indicators & Data API
‍
Strategies & Scanner
‍
Research Reports
FREE
RESOUrCES
Simple Backtest
Calculator
Simple Seasonality
Calculator
The Kelly Criterion
Calculator
Sentiment Geo Map
‍
Public Research Reports
‍
Education
Sentiment Indicators
‍
Technical Indicators
‍
Pricing
Bundle pricing
‍
FAQ
‍
Announcements
‍
COMPANY
‍
About
‍
In the News
‍
Testimonials
‍
Client Success Stories
CONTACT
‍
General Inquiries
‍
Media Inquiries
‍
Financial Professionals Inquiries
‍
© 2026 Sundial Capital Research Inc. All rights reserved.
Setsail Marketing
TermsPrivacyAffiliate Program
Risk Disclosure: The information and tools provided are for research and analytical purposes only and are not intended as investment advice. Market analysis involves uncertainty, and outcomes may differ from expectations. Users should conduct their own due diligence and consider their individual circumstances before making any financial decisions. Past performance is not necessarily indicative of future results.

Hypothetical Performance Disclosure: Hypothetical performance results have many inherent limitations, some of which are described below. No representation is being made that any account will or is likely to achieve profits or losses similar to those shown; in fact, there are frequently sharp differences between hypothetical performance results and the actual results subsequently achieved by any particular trading program. One of the limitations of hypothetical performance results is that they are generally prepared with the benefit of hindsight. In addition, hypothetical trading does not involve financial risk, and no hypothetical trading record can completely account for the impact of financial risk of actual trading. for example, the ability to withstand losses or to adhere to a particular trading program in spite of trading losses are material points which can also adversely affect actual trading results. There are numerous other factors related to the markets in general or to the implementation of any specific trading program which cannot be fully accounted for in the preparation of hypothetical performance results and all which can adversely affect trading results.

Testimonial Disclosure: Testimonials appearing on this website may not be representative of other clients or customers and is not a guarantee of future performance or success.