Products
SentimenTrader Trading Tools
‍
Backtest Engine
My Trading Toolkit
Correlation Analysis
Seasonality
Market Prediction
Indicators & Data API
‍
Proprietary Indicators & Charts
Market Data API
Strategies & Scanner
‍
50+ Trading Strategies
Smart Stock Scanner
Smart Option Scanner
Research Reports
‍
Research Solutions
Reports Library
Free Resources
Simple Backtest Calculator
Simple Seasonality Calculator
The Kelly Criterion Calculator
Sentiment Geo Map
Public Research Reports
Education
Sentiment Indicators
Technical Indicators
Pricing
Company
About
In the News
Testimonials
Client Success Stories
Contact
Log inLoginSign up
< BACK TO ALL REPORTS

Smart and Dumb Money are on equal footing

Jason Goepfert
2024-04-17
Dumb Money Confidence in a market rally has exceeded Smart Money Confidence since November. That finally ended as stocks sold off this week. Since 1998, when long streaks of optimism finally ended, the S&P 500 tended to rebound over the medium term as late bulls see their chance to get in.

Key points:

  • For the first time in almost six months, Smart Money Confidence and Dumb Money Confidence are equal
  • That ended a long streak of net optimism, which is typically only seen during ongoing bull markets
  • After streaks of optimism ended, the S&P 500 showed a strong tendency to rebound in the months ahead

Smart Money = Dumb Money

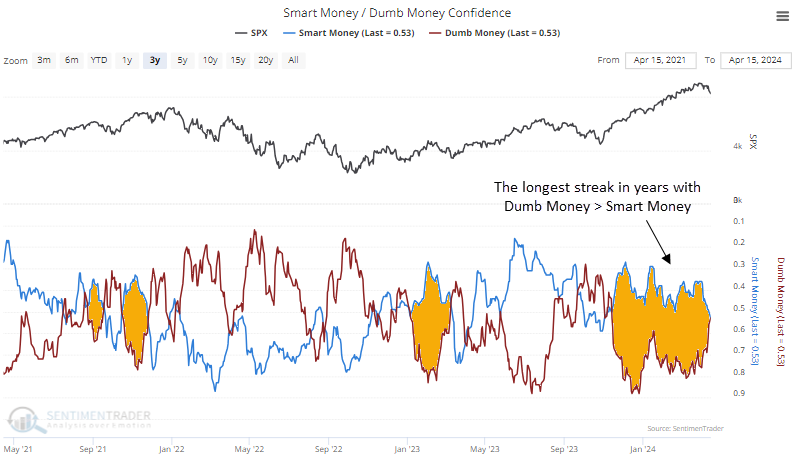
After nearly six months, investors' optimism has evaporated. All it took was a few days of selling and the cessation of some long streaks of momentum.

For the first time since November, Smart Money is assigning the same confidence of a rising market as Dumb Money. This is a stark change from just a week ago.

When we look at the spread between the two sentiment measures, we can see more clearly that they have equalized after a prolonged period of extreme. During bear markets, we generally don't see the spread last this long without reverting (the scale is inverted to more clearly show the relationship between the indicator and stock prices).

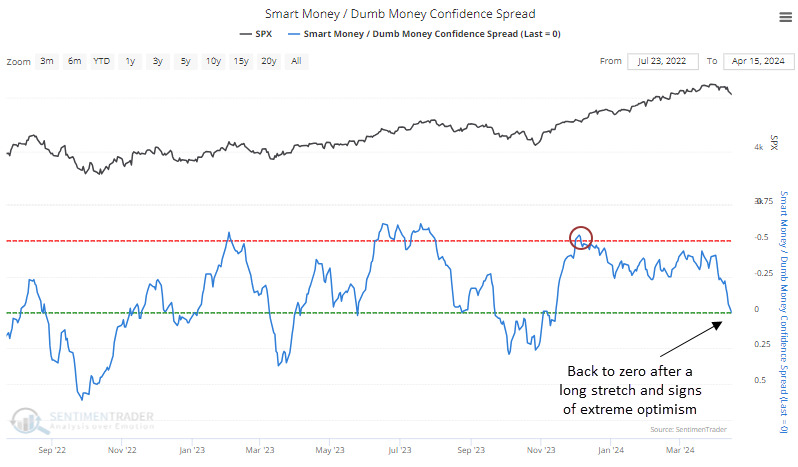
This ended the 7th-longest streak of excess since we began calculating these models in 1998.

Bulls see their chance after prolonged excess

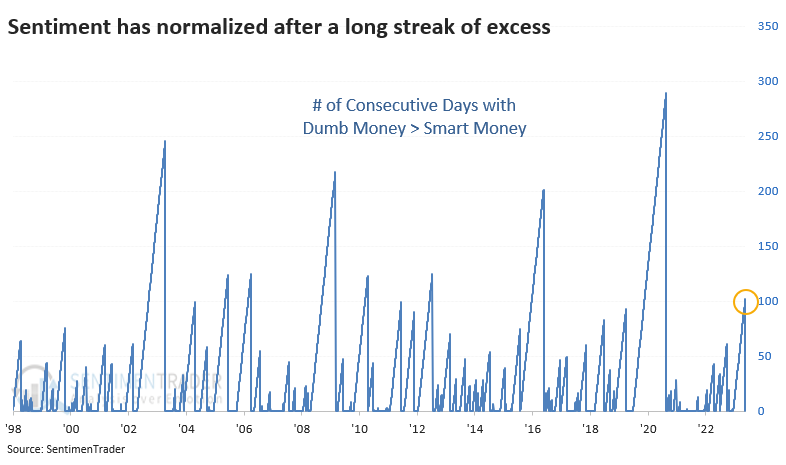
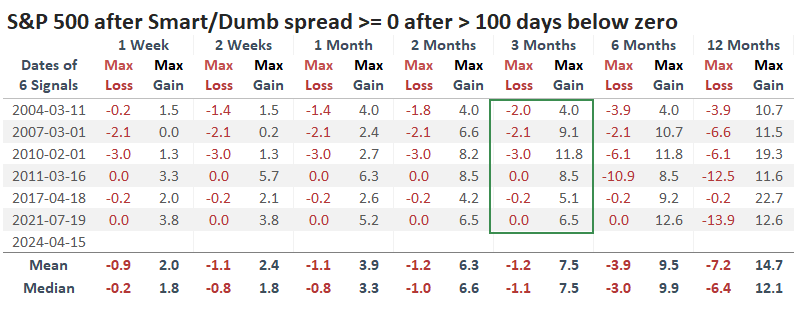
After sentiment became normalized following a long period of extreme, the S&P 500 has done very well over the medium term. It didn't suffer any losses of magnitude during the next one to three months. Note that the table only includes streaks when Dumb Money exceeded Smart Money by at least 50% at some point.

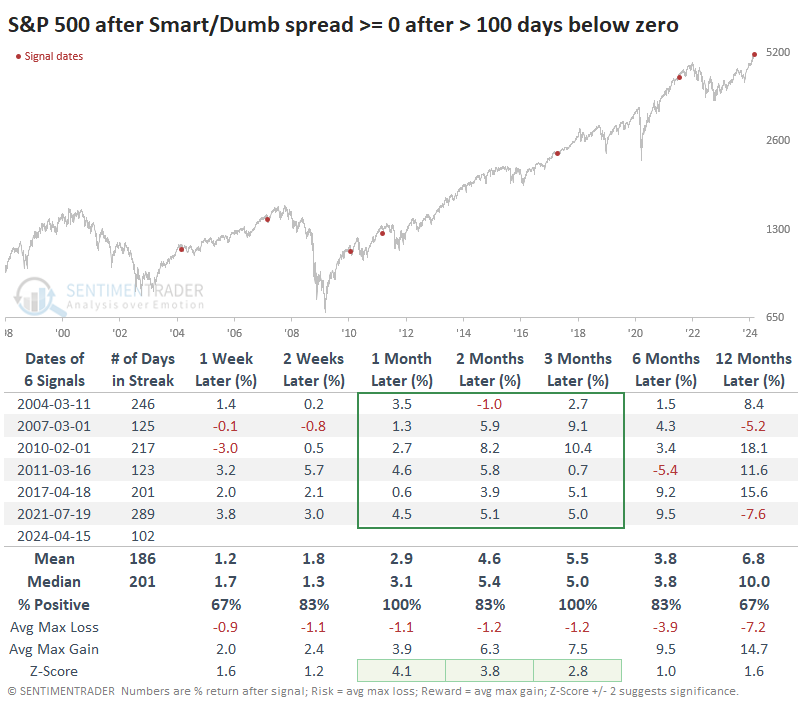
The most significant drawdown over the next three months was a minuscule -3.0%, while the average drawup (maximum gain) was +7.5%. That suggests a favorable risk/reward scenario for bulls. However, within the three months following that, there was a lot more turbulence.

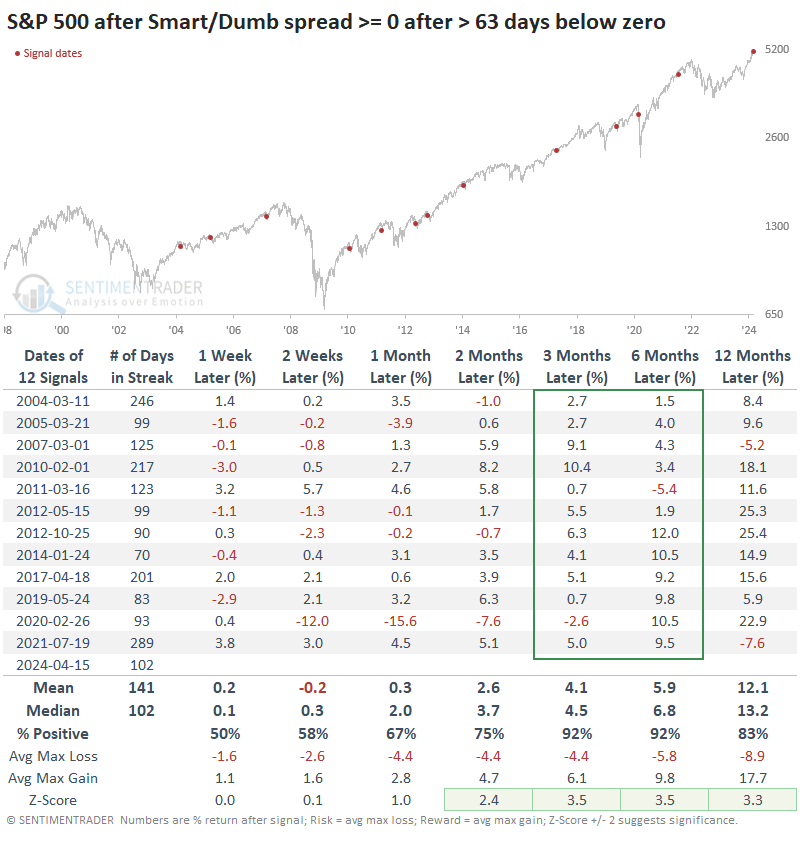
We reach the same general conclusion if we relax the parameters and look at the ends of streaks of three months or more with excessive sentiment. There were twice as many precedents, but every signal showed a gain either three or six months later. It wouldn't have been pleasant for the buyer taking this signal in February 2020, but it did work out if holding for six months+.

What the research tells us...

Last fall, stocks held up magnificently well even after sentiment initially reached extreme optimism. That's a hallmark of developing bull markets and proved to be so once again. Now that we've had the first taste of real selling pressure since November, investors have quickly become fearful, or at least a heck of a lot less optimistic.

When sentiment normalizes after a prolonged stretch of extreme, it has never resulted in an immediate bear market. Or even correction. Or really even a pullback. Bulls who missed out on the gains finally see their chance to get in, and without fail, they've pounced. Of course, we're relying on investors behaving like they have for the past 25 years, which might not work. But the one thing we've become most confident about over the decades is that human behavior is the most reliable aspect of auction markets.

PRODUCTS
SentimenTrader
Trading Tools
Indicators & Data API
‍
Strategies & Scanner
‍
Research Reports
FREE
RESOUrCES
Simple Backtest
Calculator
Simple Seasonality
Calculator
The Kelly Criterion
Calculator
Sentiment Geo Map
‍
Public Research Reports
‍
Education
Sentiment Indicators
‍
Technical Indicators
‍
Pricing
Bundle pricing
‍
FAQ
‍
Announcements
‍
COMPANY
‍
About
‍
In the News
‍
Testimonials
‍
Client Success Stories
CONTACT
‍
General Inquiries
‍
Media Inquiries
‍
Financial Professionals Inquiries
‍
© 2026 Sundial Capital Research Inc. All rights reserved.
Setsail Marketing
TermsPrivacyAffiliate Program
Risk Disclosure: The information and tools provided are for research and analytical purposes only and are not intended as investment advice. Market analysis involves uncertainty, and outcomes may differ from expectations. Users should conduct their own due diligence and consider their individual circumstances before making any financial decisions. Past performance is not necessarily indicative of future results.

Hypothetical Performance Disclosure: Hypothetical performance results have many inherent limitations, some of which are described below. No representation is being made that any account will or is likely to achieve profits or losses similar to those shown; in fact, there are frequently sharp differences between hypothetical performance results and the actual results subsequently achieved by any particular trading program. One of the limitations of hypothetical performance results is that they are generally prepared with the benefit of hindsight. In addition, hypothetical trading does not involve financial risk, and no hypothetical trading record can completely account for the impact of financial risk of actual trading. for example, the ability to withstand losses or to adhere to a particular trading program in spite of trading losses are material points which can also adversely affect actual trading results. There are numerous other factors related to the markets in general or to the implementation of any specific trading program which cannot be fully accounted for in the preparation of hypothetical performance results and all which can adversely affect trading results.

Testimonial Disclosure: Testimonials appearing on this website may not be representative of other clients or customers and is not a guarantee of future performance or success.