
Small speculators are loaded for bull

Key points
- Small speculators in stock indexes have reached their most bullish net position ever
- This action does not in and of itself constitute a "sell" signal
- It does, however, suggest that sentiment may be moving from a positive to a potential negative for stocks
Small Spec Index Position indicator soars
It is important to remember that not every indicator is a "trading system." Likewise, not every movement by every indicator "means something." Lastly, most indicators are best used as "weight of the evidence" and not as a singular call to action.
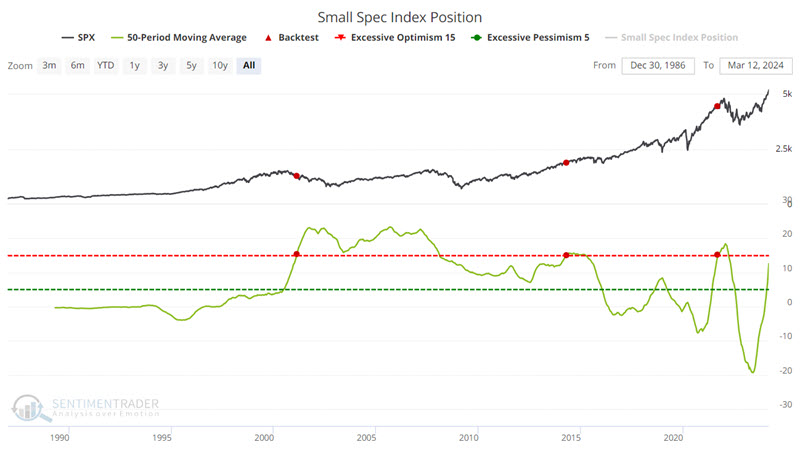
With those thoughts in mind, it is interesting to note the current level of bullishness among small stock index speculators in the chart below.
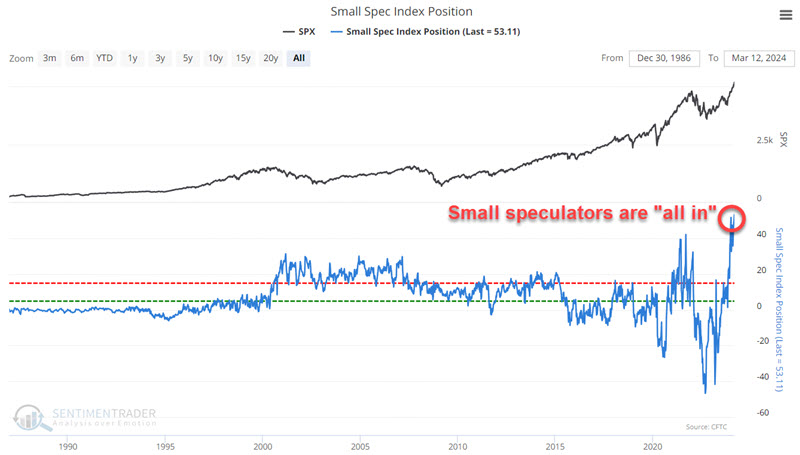
The chart above shows the net position of small (nonreportable) traders in S&P 500, Nasdaq 100, and DJIA index futures, full contract, and e-min, adjusted for position size and index value, shown in billions of dollars.
As small speculators tend to be the "Wrong Way Corrigan's" of the stock market, it can be helpful to note when their bet position reaches an extreme - such as now. The chart above shows that the latest indicator value is at its highest since this database began.
If I were bearish on the stock market - and were prone to make definitive statements about it - it would be tempting to intone, "Small speculators reach their most bullish level ever, which clearly presages the end of the bull market and an impending disaster for stocks!" See how fun that is?
But that approach is not my style. Our mission at Sentimentrader is to present objective data without that kind of commentary. Also, FWIW, the stuff I follow remains net bullish on stocks. Still, it is worth examining the chart above a little more closely.
High readings do tend to be unfavorable for stocks (depending on your timeframe)
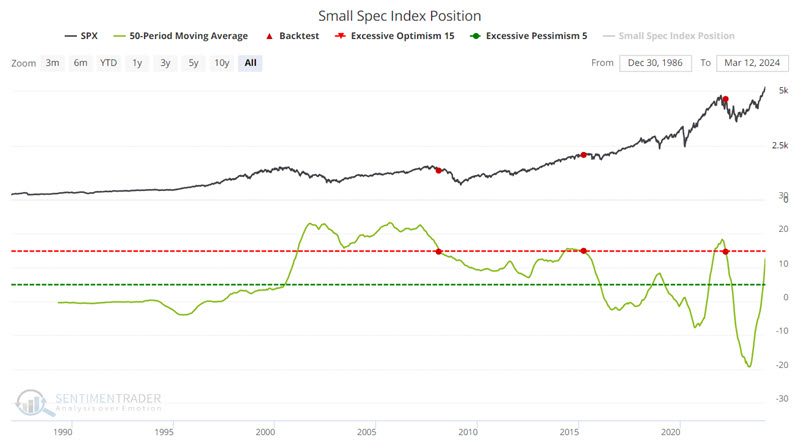
The chart below highlights all weeks when the Small Spec Index Position indicator was above 29.
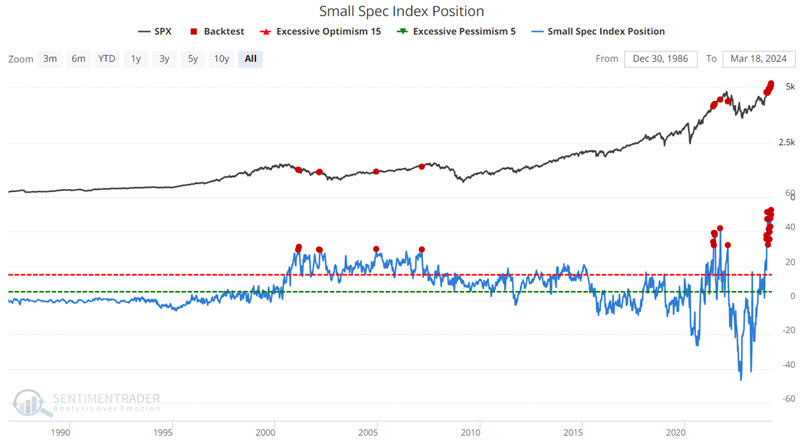
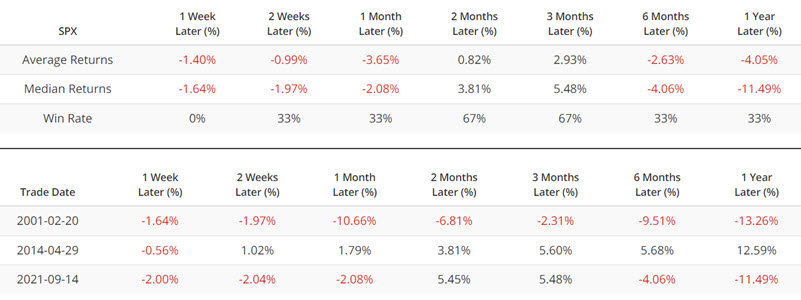
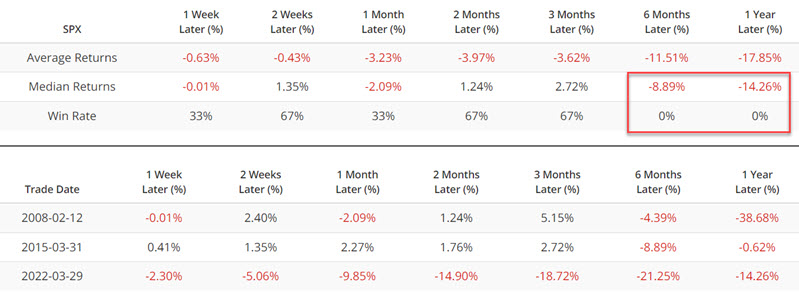
The table below summarizes the S&P 500 performance following these readings.
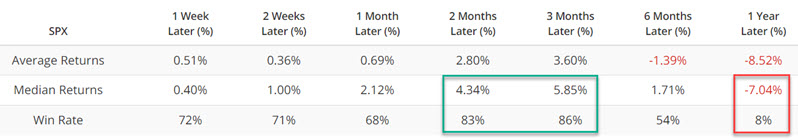
Small speculators jumped on the late 2023 rally and have kept adding to bullish positions since. Interestingly, they have shown a tendency to be right - for a while - before everything typically goes wrong.
As you can see in the table above, the Win Rate for two months and three months is 83% and 86%, respectively. But from there, things have tended to go seriously south. The 12-month Win Rate is only 8%, with a median decline of -7.04%.
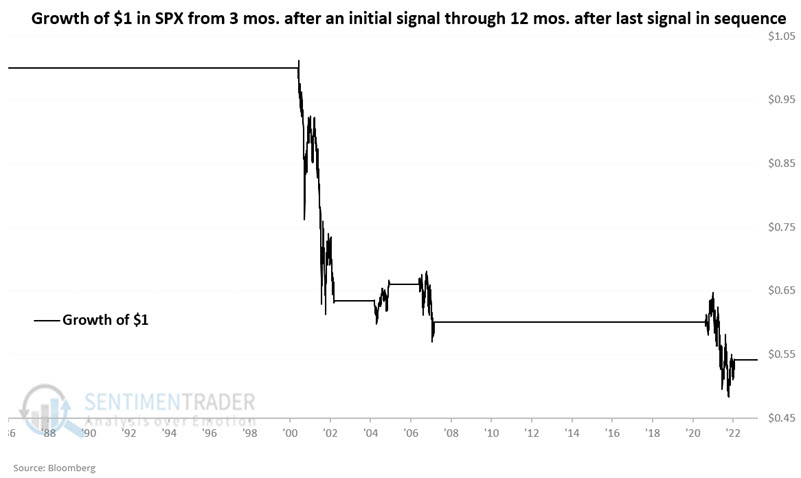
Note that this indicator has given a reading above 29 every week since 2023-12-19, which implies we are nearing the 3-month point since that signal. Does this matter? There is no way to predict. It is important to note that we are talking about a tiny sample size (this is essentially only the 5th "signal" for this iteration of this indicator), so we should be careful about drawing conclusions and assuming that the stock market will now decline sharply over the next nine months based solely on the limited history of this one indicator.
Still, the chart below displays the hypothetical growth of $1 invested in the S&P 500 Index only from three months following an initial signal through 12 months after the initial signal - or any overlapping signals (i.e., a new signal that occurs within 12 months of a previous signal extends the holding period for another 12 months).
The table below displays the S&P 500 performance for the periods depicted in the chart above (including extended periods based on overlapping signals).
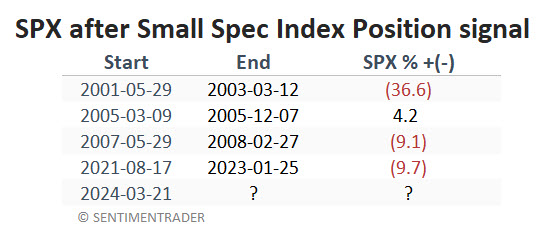
A longer-term approach (and an even smaller sample size) is depicted in the chart below, which highlights those dates when the 50-week average of the Small Spec Index Position indicator rose above 15. The table below summarizes the S&P 500 performance following those rare occasions. Note that the 50-week average has not yet reached 15 but presently stands at 12.59, is rising, and will likely cross above 15 in the not-too-distant future.
One last scenario to consider is when the 50-week average rises above 15 and then closes back below 15. Those occasions appear in the chart and table below.
What the research tells us…
It is essential to remember that the highlighted indicator is only one of many indicators that may or may not be meaningful at any given time. In other words, whatever it purports to say, it is merely "weight of the evidence" and not a definitive buy or sell signal. Likewise, the sample sizes of the signals highlighted are so small that one must be cautioned to judge results with a grain of salt. With those caveats firmly in place, we must nevertheless place the recent action of this indicator on the unfavorable side of the weight of the evidence ledger.
NOTE: For another look at the Small Spec Index Position indicator and a systematic approach to using it, see this article.