
Small speculators are loaded for bear

NOTE: The first part of this article was published as a Public post on 2023-05-15. In this subscriber-only post, we add specific rules to turn the Small Spec Index Position indicator into a standalone trading model.
Key points
- Small speculators in the stock index futures markets have recently been very heavily positioned to the short side
- This is a bullish contrarian event, as small speculators have a long history of fighting/being on the wrong side of major trends
- A longer-term moving average of weekly data makes the results more useful for contrarian traders
- By adding some specific rules, we can create a simple model to use this indicator to identify specific favorable and unfavorable periods
The current state of affairs
Where the stock market is headed next is always open to debate. But one thing is clear - small speculators in the stock index futures markets are betting heavily on declining stock prices.
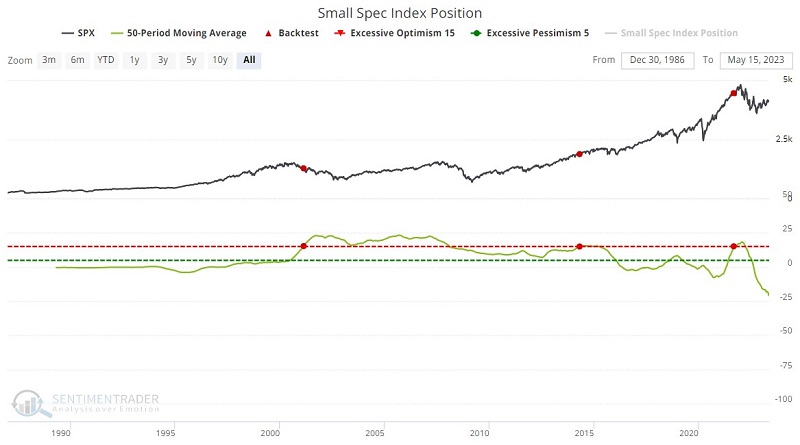
Our Small Spec Index Position indicator shows the net position of small (nonreportable) traders in S&P 500, Nasdaq 100, and DJIA index futures, full contract, and e-min, adjusted for position size and index value, shown in billions of dollars. The raw data comes from the CFTC Commitment of Traders report.
As you can see in the chart below, small speculators have gotten quite bearish. Whether they are speculating for profit, hedging existing stock positions, or some combination thereof, the implication is clear - "the Little Guy" is betting heavily on a near-term decline in the stock market.
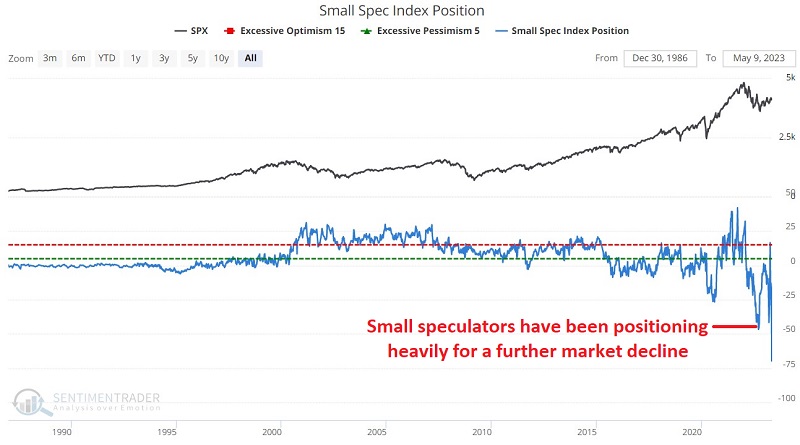
Notably, on 2023-05-05, the CFTC began including e-micro contracts for the S&P 500, Nasdaq 100, and DJIA indexes. On the one hand, this change likely explains some of the recent plunge toward the end of the chart above. On the other hand, this change will likely (in this author's opinion) make this indicator even more valuable over time, as micro contracts are almost exclusively a venue for small speculators. So including this data will make this indicator even more sensitive to the actions of "the Little Guy." In addition, as you will see below, I apply a 50-week moving average to the data for doing analysis for trading purposes. So any short-term aberrations or data shocks will eventually be smoothed out.
As always, we try to take an objective approach to analyzing historical and recent data.
A closer look at indicator results
For the record, the indicator is intended to be just that - an indicator that offers a bullish, bearish, or neutral leaning to the weight of the evidence - and not a standalone trading model. Let's take a closer look.
First, the basic premise underlying this indicator is that the community of small speculators represents a large group of unsophisticated investors. While individual investors within this community may experience greater or lesser degrees of overall success, when this group leans too far in one direction, they typically get it wrong. As a result, this is viewed as a contrary indicator. Higher readings from this indicator (i.e., small speculators are getting more bullish) are considered bearish for stocks, and lower readings (i.e., small speculators are getting more bearish) are considered bullish for stocks.
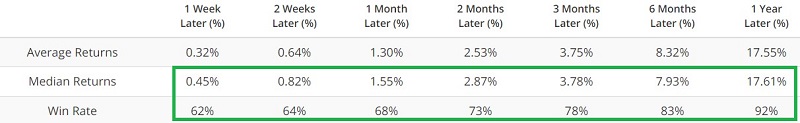
The chart and table below display S&P 500 Index results when the indicator is below 5. Average and Median returns and the Win Rate improve with each passing time period. The median 12-month return is 17.61%, with a Win Rate of 92%.

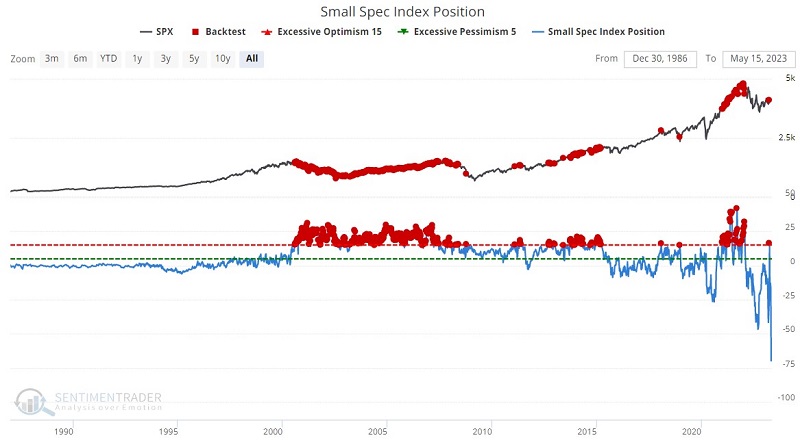
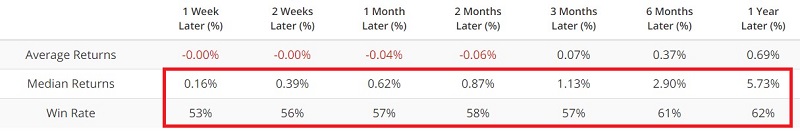
Conversely, the chart and table below display S&P 500 results when the indicator is above 15. While the results cannot be termed "bearish," they are noticeably inferior to the market's performance when the indicator is below 5.
To make the results more useful for actual trading purposes, let's smooth out the results by applying a 50-week moving average.
Results using a 50-week moving average
The chart and table below display the S&P 500 Index results when the 50-week indicator moving average is below 5. The results align with the favorable results shown above for 1-week readings. Once again, the implication is clear - small speculators tend to be wary of bull markets - to their detriment, as the market tends to perform well when small specs are not heavily positioned for an advance.


On the other side, let's look separately at market results when the 50-week average:
- Crosses above 15
- Crosses below 15
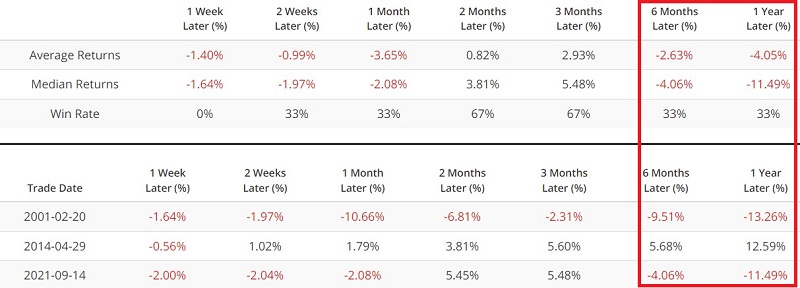
The chart and table below display the S&P 500 Index results when the 50-week indicator moving average first crosses above 15K.
The chart and table below display the S&P 500 Index results when the 50-week indicator moving average first crosses below 15K.

The sample sizes are exceedingly small, so there is a potential danger in attempting to draw specific conclusions. Nevertheless, if one buys the premise that small speculators are the "Wrong Way Corrigan" of the stock market, the implication is pretty straightforward. Whether the 50-week average is crossing above or below 15K - i.e., whether small speculators are piling into bullish positions or beginning to rush the exits - it is not favorable for stocks.
Transforming the indicator into a trading model
As mentioned above, the original purpose of the indicator is to provide "weight of the evidence" as appropriate to the bullish or bearish case. Now let's go one step further and attempt to build a model that can give bullish or bearish signals based on a specific set of rules.
We will use the 50-week moving average of the weekly Small Spec Index Position indicator readings as Variable A.
The model becomes bullish when:
- Variable A crosses below +5.0
The model ceases to be bullish, either:
- When Variable A crosses above +15.0, OR
- One year after Variable A crosses above +5.0
The model becomes bearish when:
- Variable A crosses above +15.0
The model ceases to be bearish, either:
- When Variable A crosses below +5.0, OR
- One year after Variable A crosses below +15.0
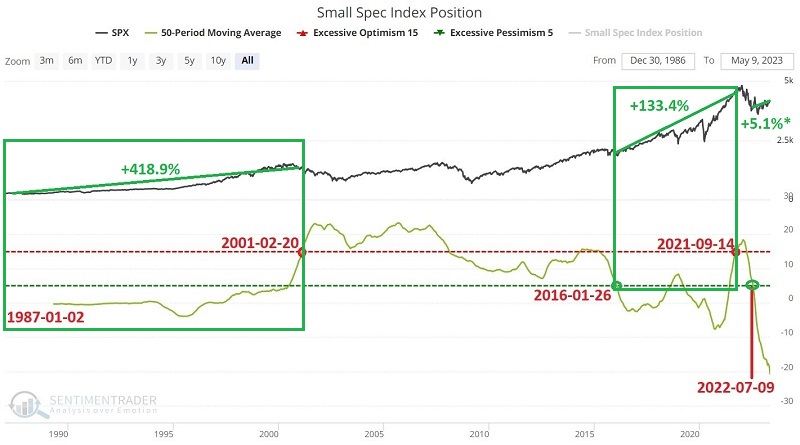
A closer look at bullish signals
The chart and table below display S&P 500 performance during the bullish periods using the rules above. These periods are considered bullish specifically because small speculators were not bullish.
The chart below displays the growth of $1 invested in the S&P 500 only during the bullish periods identified using the rules appearing above. 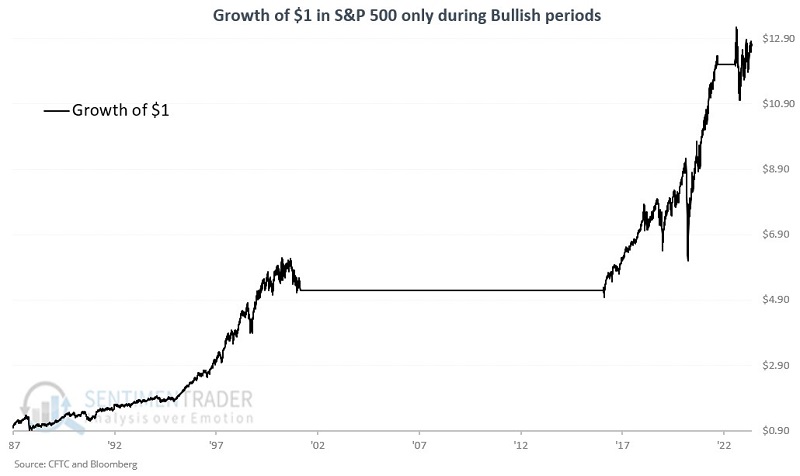
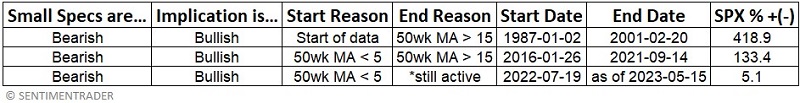
The most recent bullish period that started on 2022-07-22 is still active and will remain so until the 50-week moving average either rises above +15.0 or spends 52 weeks above +5.0. With the 50-week average at a current all-time low of -20.75, that may take a while.
While this model is presently rated as bullish, it is essential to remember that it does not guarantee an endless bull market. Note that the model was rated as bullish during the Crash of 1987, the bear market year of 2018, and the Covid collapse in early 2020.
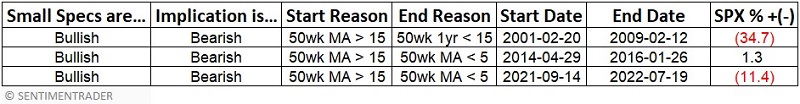
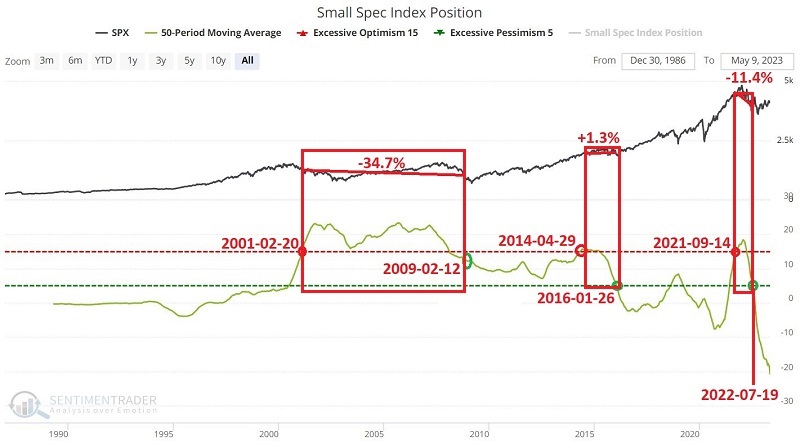
A closer look at bearish signals
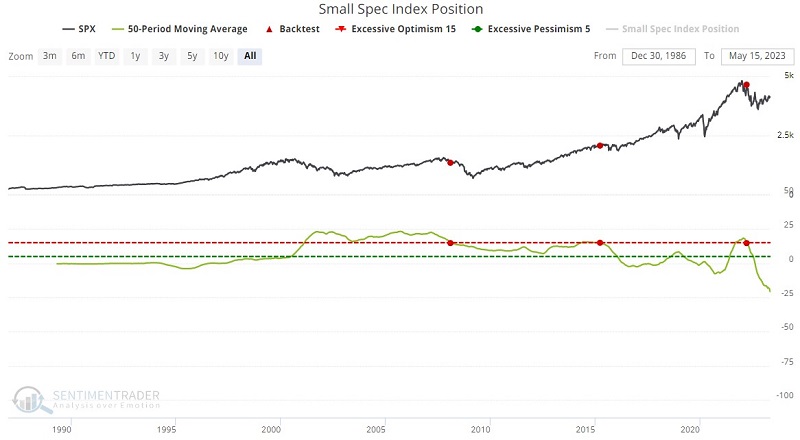
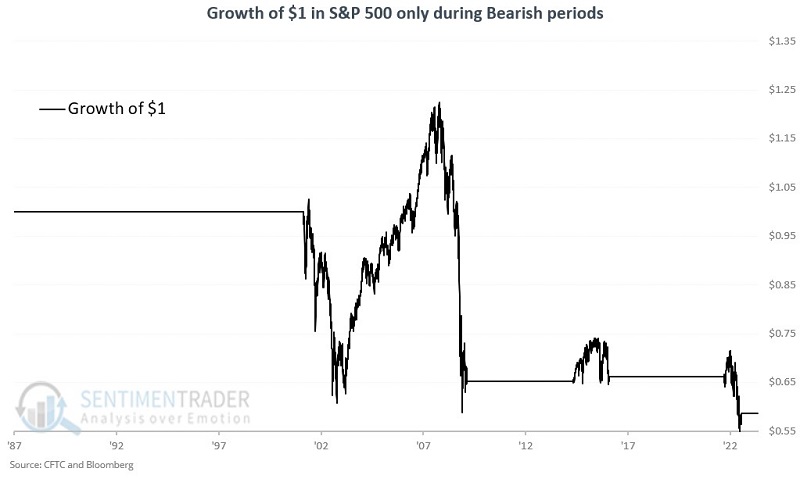
The chart and table below display S&P 500 performance during the bearish periods using the rules above. These periods are considered bearish specifically because small speculators were bullish.
The chart below displays the growth of $1 invested in the S&P 500 only during the bearish periods identified using the rules appearing above.
What the research tells us…
Since the dawn of trading, fear and greed are the emotions that tend to get investors in trouble. Human nature dictates that people become more pessimistic and fearful when prices fall and more hopeful and euphoric when prices rise. The statistics shown above illustrate that it is best to be optimistic about the market when the community of small speculators is fighting a bullish trend (a smaller-than-average long position or even a net short position) and to be more defensive when they are flocking to the bullish side (an above average long position).