Products
SentimenTrader Trading Tools
‍
Backtest Engine
My Trading Toolkit
Correlation Analysis
Seasonality
Market Prediction
Indicators & Data API
‍
Proprietary Indicators & Charts
Market Data API
Strategies & Scanner
‍
50+ Trading Strategies
Smart Stock Scanner
Smart Option Scanner
Research Reports
‍
Research Solutions
Reports Library
Free Resources
Simple Backtest Calculator
Simple Seasonality Calculator
The Kelly Criterion Calculator
Sentiment Geo Map
Public Research Reports
Education
Sentiment Indicators
Technical Indicators
Pricing
Company
About
In the News
Testimonials
Client Success Stories
Contact
Log inLoginSign up
< BACK TO ALL REPORTS

Small caps when strong internals are a trap

by Sentimentrader
2026-03-24
The Russell 2000 has posted a rapid 10% correction from a 3-year high in under 30 days. Counterintuitively, strong underlying market breadth during this pullback has historically amplified intermediate-term downside risks, with a bearish outlook for small caps over the next 2-3 months.

Key points:

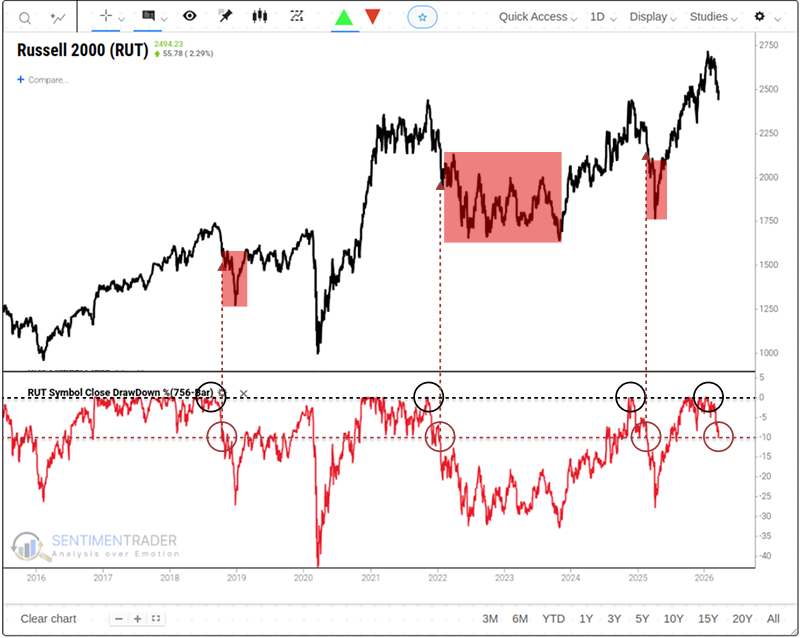
  • The Russell 2000 just completed a rapid -10% correction from a three-year high.
  • Historical base rates for this specific technical breakdown skew bearish over the next two to three months.
  • Counterintuitively, strong underlying breadth during the breakdown has historically led to worse intermediate-term outcomes.

A sudden air pocket

The relentless small-cap rally hit a wall last week. On March 20, the Russell 2000 closed 10% below its recent three-year high. The speed matters. This reversal played out in under 30 days, catching offsides a market positioned for an uninterrupted expansion.

Small caps when strong internals are a trap

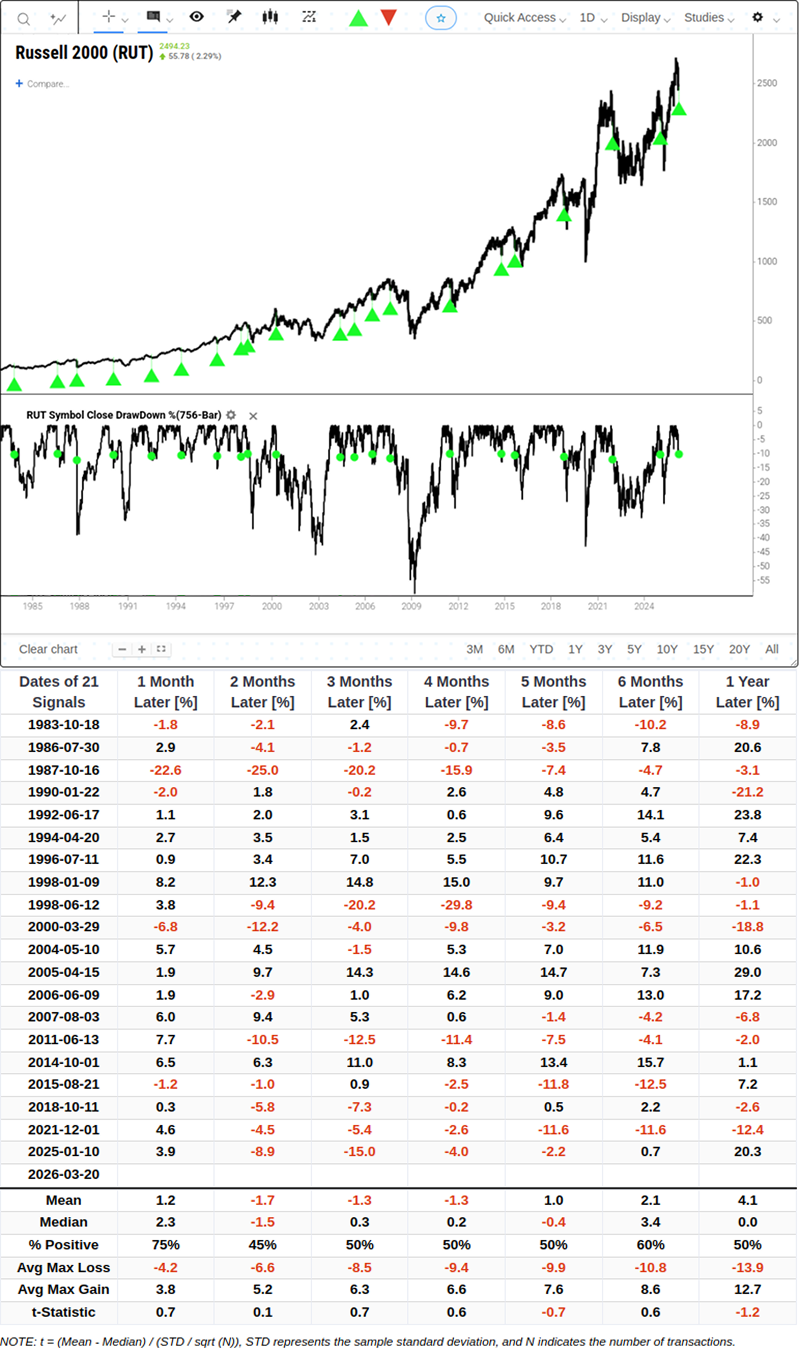
Across the 21 times the index has fallen from a three-year high into a correction since 1983, the forward returns are persistently choppy. Over the following two months, the index was higher only 45% of the time, averaging a 1.7% loss. The longer-term risk-reward profile is decidedly symmetrical. Over the subsequent year, the index offered an average maximum gain of 12.7% against an average maximum drawdown of 13.9%.

Small caps when strong internals are a trap

Speed kills momentum

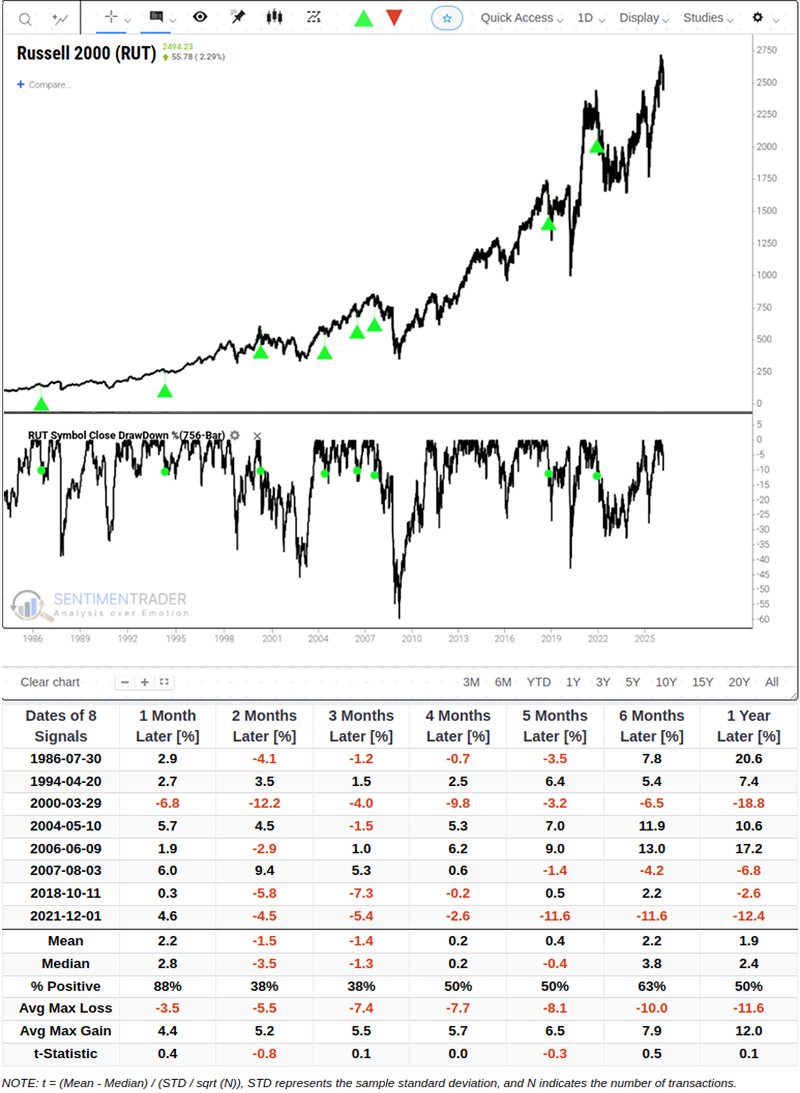
Fast reversals compound the near-term weakness. Narrowing the lens to corrections that materialized within 30 trading days leaves only eight prior signals. The two- and three-month forward returns for this cohort are dismal. The index was positive just 38% of the time across both windows, averaging outright losses. A sudden shift in the prevailing trend typically requires months of consolidation before a durable bottom forms.

Small caps when strong internals are a trap

The breadth trap

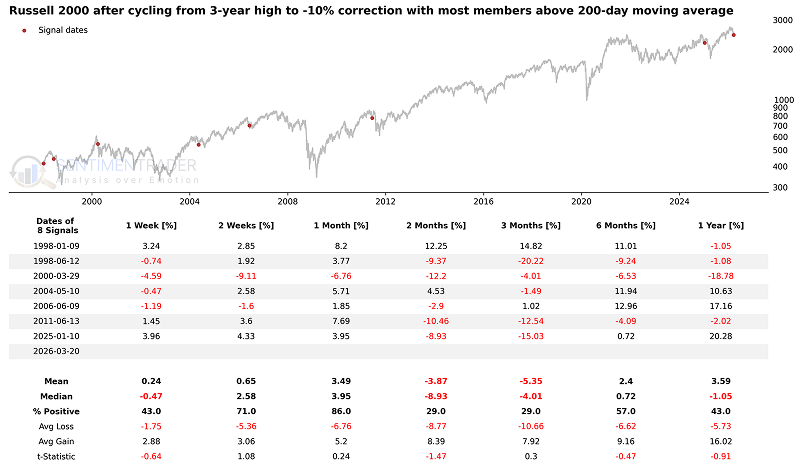
Counterintuitively, resilient internals make the setup more dangerous. We typically view strong underlying participation as a structural shock absorber during index-level drawdowns. The data points the other way. When the Russell 2000 drops into a correction with the majority of its members still holding above their 200-day moving averages, the selling tends to accelerate.

Small caps when strong internals are a trap

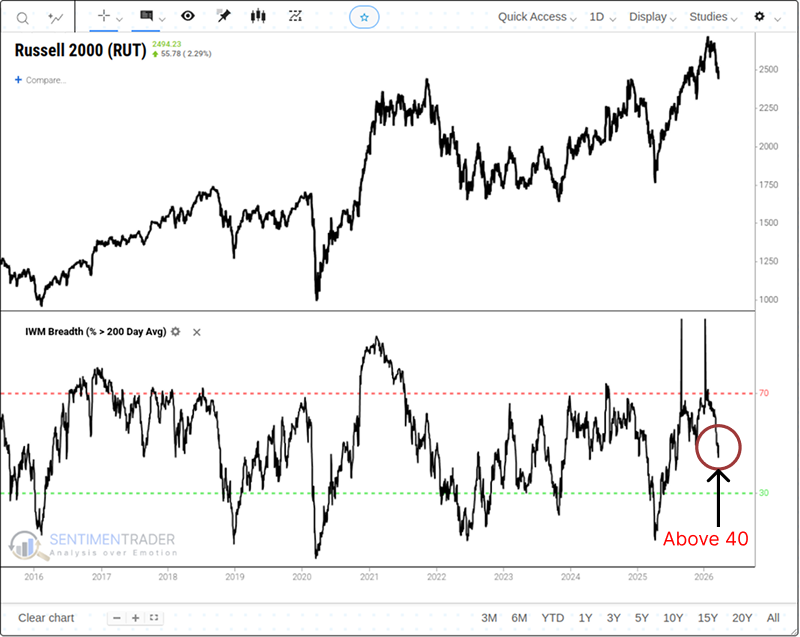
Across the eight signals featuring the strongest breadth, the two- and three-month forward returns were positive only 29% of the time. The index averaged a loss of roughly 4% to 5% over those windows, and the one-year win rate drops below a coin flip. This suggests that when the index breaks down but individual stocks haven't fully rolled over, the market is merely in the early innings of a broader capitulation.

Small caps when strong internals are a trap

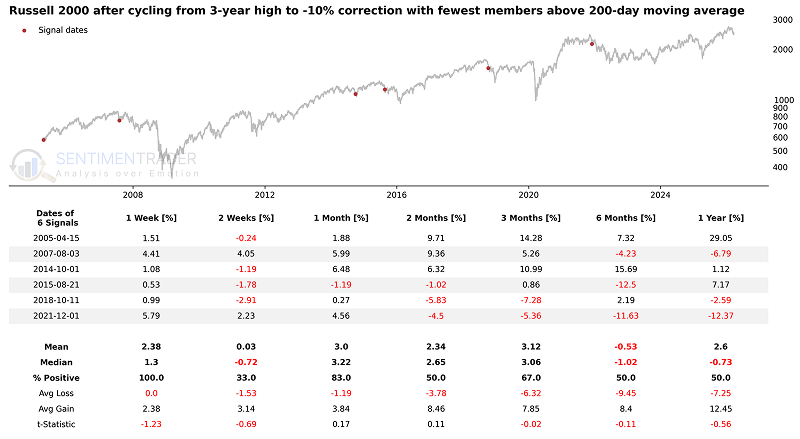
Compare that to corrections driven by entirely washed-out markets. When the fewest members hold their long-term averages at the time of the signal, the near-term returns flip positive. Over the following month, the index was higher 83% of the time. A breakdown built on already-depressed internals sets the stage for a mean-reversion bounce. A breakdown with elevated breadth implies there is plenty of dead wood left to clear.

Small caps when strong internals are a trap

What the research tells us...

Price action demands respect, and the underlying internals confirm the need for caution. The rapid 10% drawdown from multi-year highs carries a bearish base rate across the medium term. Strong participation above the 200-day moving average historically amplifies that downside risk rather than neutralizing it. History favors a cascading selloff as the remaining stocks holding onto their long-term trends eventually succumb to the gravity of the index. The setup argues for defensive positioning over the next quarter. If the remaining constituents rapidly break below their moving averages, the conditions for a durable, washed-out bottom may begin to form.

PRODUCTS
SentimenTrader
Trading Tools
Indicators & Data API
‍
Strategies & Scanner
‍
Research Reports
FREE
RESOUrCES
Simple Backtest
Calculator
Simple Seasonality
Calculator
The Kelly Criterion
Calculator
Sentiment Geo Map
‍
Public Research Reports
‍
Education
Sentiment Indicators
‍
Technical Indicators
‍
Pricing
Bundle pricing
‍
FAQ
‍
Announcements
‍
COMPANY
‍
About
‍
In the News
‍
Testimonials
‍
Client Success Stories
CONTACT
‍
General Inquiries
‍
Media Inquiries
‍
Financial Professionals Inquiries
‍
© 2026 Sundial Capital Research Inc. All rights reserved.
Setsail Marketing
TermsPrivacyAffiliate Program
Risk Disclosure: The information and tools provided are for research and analytical purposes only and are not intended as investment advice. Market analysis involves uncertainty, and outcomes may differ from expectations. Users should conduct their own due diligence and consider their individual circumstances before making any financial decisions. Past performance is not necessarily indicative of future results.

Hypothetical Performance Disclosure: Hypothetical performance results have many inherent limitations, some of which are described below. No representation is being made that any account will or is likely to achieve profits or losses similar to those shown; in fact, there are frequently sharp differences between hypothetical performance results and the actual results subsequently achieved by any particular trading program. One of the limitations of hypothetical performance results is that they are generally prepared with the benefit of hindsight. In addition, hypothetical trading does not involve financial risk, and no hypothetical trading record can completely account for the impact of financial risk of actual trading. for example, the ability to withstand losses or to adhere to a particular trading program in spite of trading losses are material points which can also adversely affect actual trading results. There are numerous other factors related to the markets in general or to the implementation of any specific trading program which cannot be fully accounted for in the preparation of hypothetical performance results and all which can adversely affect trading results.

Testimonial Disclosure: Testimonials appearing on this website may not be representative of other clients or customers and is not a guarantee of future performance or success.