Products
SentimenTrader Trading Tools
‍
Backtest Engine
My Trading Toolkit
Correlation Analysis
Seasonality
Market Prediction
Indicators & Data API
‍
Proprietary Indicators & Charts
Market Data API
Strategies & Scanner
‍
50+ Trading Strategies
Smart Stock Scanner
Smart Option Scanner
Research Reports
‍
Research Solutions
Reports Library
Free Resources
Simple Backtest Calculator
Simple Seasonality Calculator
The Kelly Criterion Calculator
Sentiment Geo Map
Public Research Reports
Education
Sentiment Indicators
Technical Indicators
Pricing
Company
About
In the News
Testimonials
Client Success Stories
Contact
Log inLoginSign up
< BACK TO ALL REPORTS

Small caps wash out and large caps win

by Sentimentrader
2026-05-19
Sentimentrader analysis shows the Small Cap/S&P 500 Relative Ratio Rank collapsed from above 95 to below 15 in just 21 trading days. Historical data reveals this extreme fast washout favors large caps over small caps, with the S&P 500 higher 83% of the time a year later.

Key points

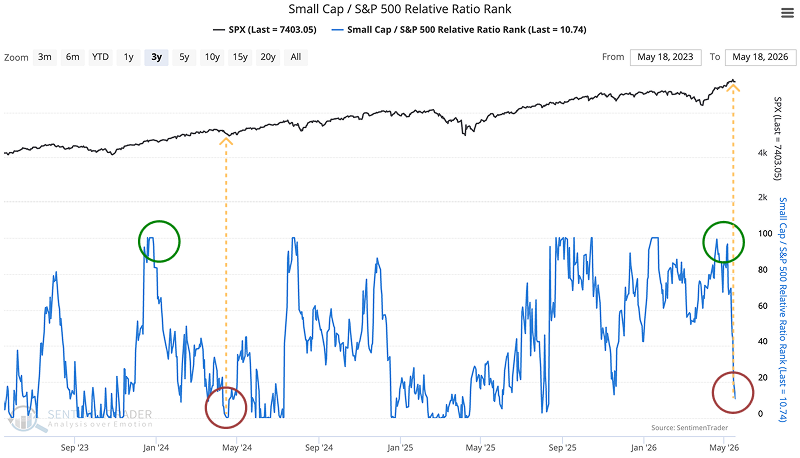
  • The Small Cap / S&P 500 Relative Ratio Rank collapsed from above 95 to below 15, completing the cycle in one month
  • The broad signal saw SPX higher 83% of the time a year later, averaging a 10.6% gain
  • Tightening for speed produces 9 signals, SPX was higher a month later every single time, while RUT lagged
  • Extreme small-cap washouts favor large caps, not the beaten-down small caps

One indicator just did something

Small Cap / S&P 500 Relative Ratio Rank went from the top of its range to the bottom, above 95 to below 15, in 21 trading days. The rank closed at 10.74 on Monday, with the S&P 500 at 7,403. Small caps have been routed relative to large caps, and the speed of the rout is what makes this one stand out.

I'll be honest, my first instinct when I saw this ratio crash was that it was a screaming small-cap buy signal. I was wrong. The backtest data tells a very different story.

The broad signal

Drop the speed filter. Just the ratio rank going from above 95 to below 15, regardless of how long it takes, has happened 32 times. Across those, the

Sorry, you don't have access to this report

Upgrade your subscription plan to get access
Go to Dasboard
PRODUCTS
SentimenTrader
Trading Tools
Indicators & Data API
‍
Strategies & Scanner
‍
Research Reports
FREE
RESOUrCES
Simple Backtest
Calculator
Simple Seasonality
Calculator
The Kelly Criterion
Calculator
Sentiment Geo Map
‍
Public Research Reports
‍
Education
Sentiment Indicators
‍
Technical Indicators
‍
Pricing
Bundle pricing
‍
FAQ
‍
Announcements
‍
COMPANY
‍
About
‍
In the News
‍
Testimonials
‍
Client Success Stories
CONTACT
‍
General Inquiries
‍
Media Inquiries
‍
Financial Professionals Inquiries
‍
© 2026 Sundial Capital Research Inc. All rights reserved.
Setsail Marketing
TermsPrivacyAffiliate Program
Risk Disclosure: The information and tools provided are for research and analytical purposes only and are not intended as investment advice. Market analysis involves uncertainty, and outcomes may differ from expectations. Users should conduct their own due diligence and consider their individual circumstances before making any financial decisions. Past performance is not necessarily indicative of future results.

Hypothetical Performance Disclosure: Hypothetical performance results have many inherent limitations, some of which are described below. No representation is being made that any account will or is likely to achieve profits or losses similar to those shown; in fact, there are frequently sharp differences between hypothetical performance results and the actual results subsequently achieved by any particular trading program. One of the limitations of hypothetical performance results is that they are generally prepared with the benefit of hindsight. In addition, hypothetical trading does not involve financial risk, and no hypothetical trading record can completely account for the impact of financial risk of actual trading. for example, the ability to withstand losses or to adhere to a particular trading program in spite of trading losses are material points which can also adversely affect actual trading results. There are numerous other factors related to the markets in general or to the implementation of any specific trading program which cannot be fully accounted for in the preparation of hypothetical performance results and all which can adversely affect trading results.

Testimonial Disclosure: Testimonials appearing on this website may not be representative of other clients or customers and is not a guarantee of future performance or success.