
Small caps fall into a correction

Key points:
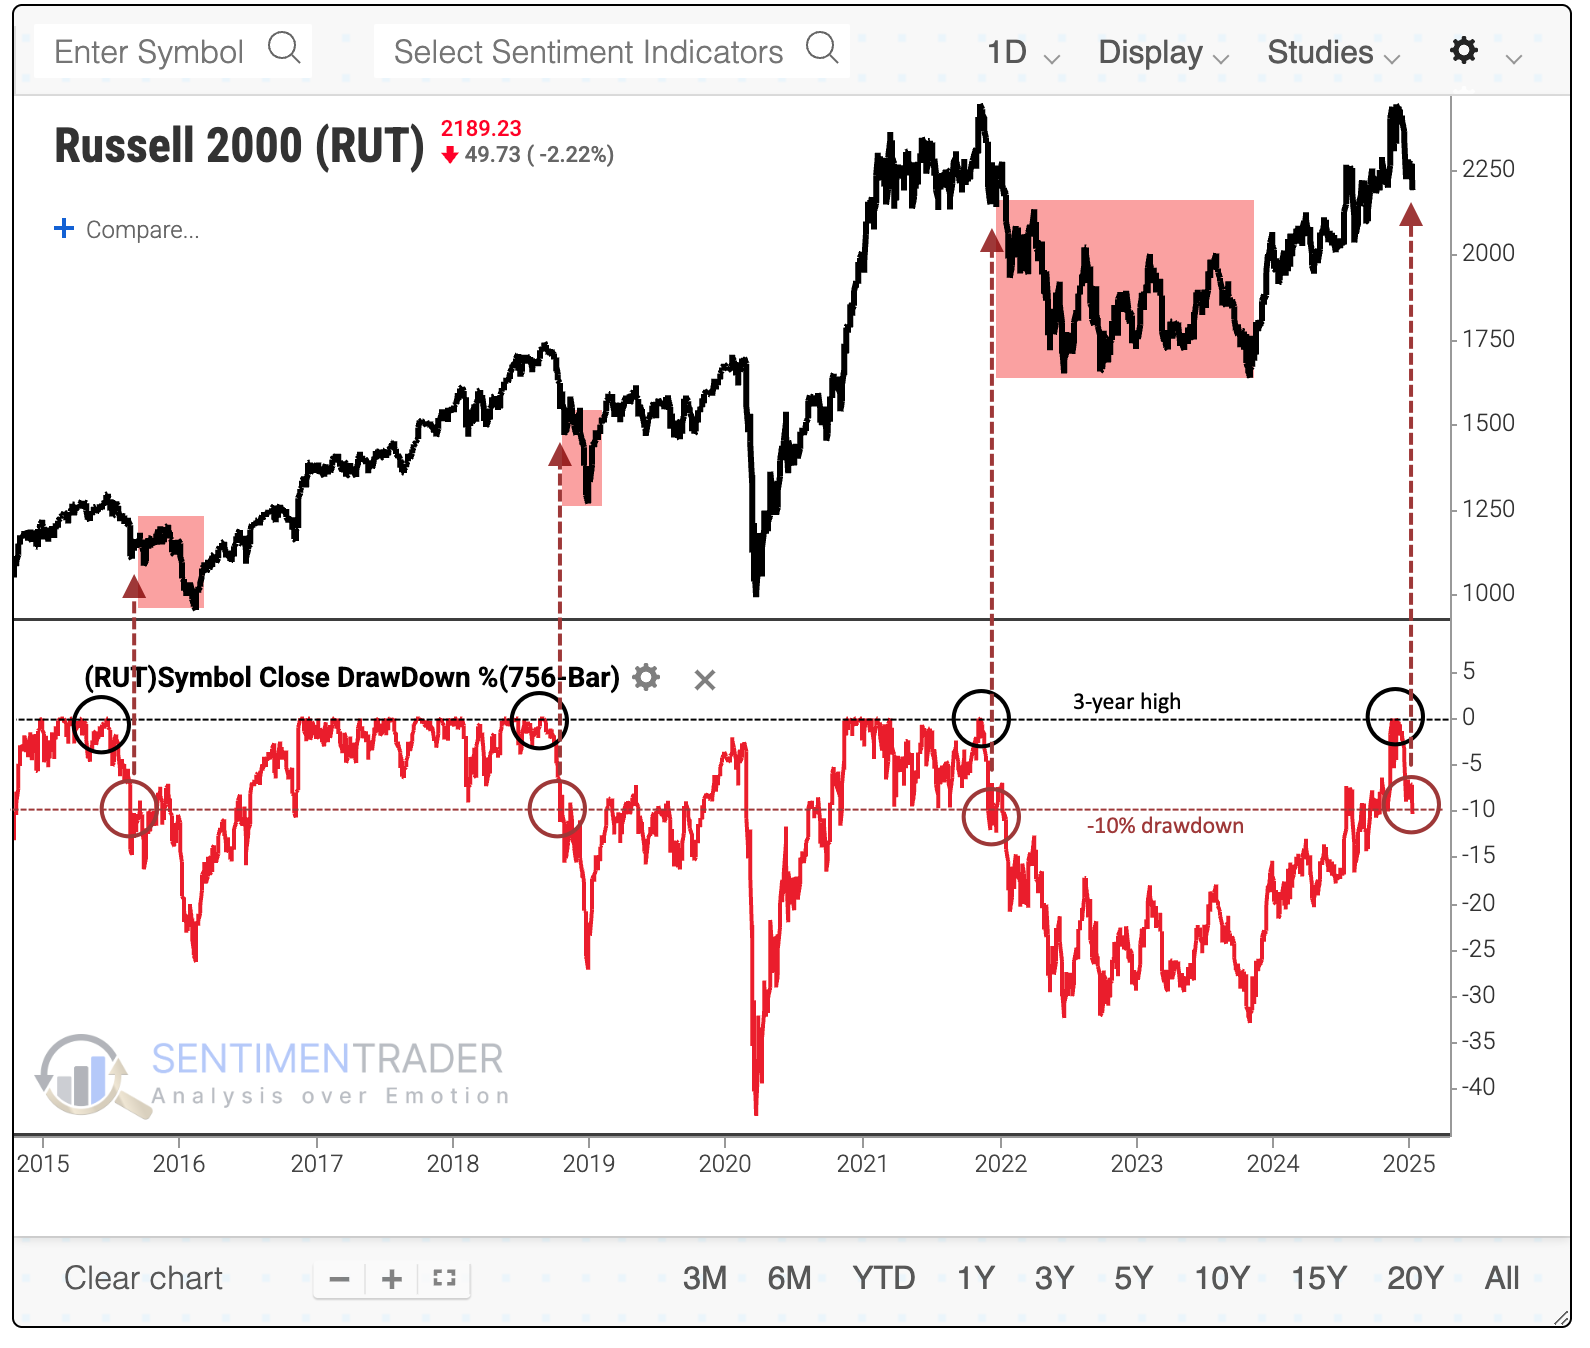
- The small-cap Russell 2000 has quickly cycled from a new high to a -10% correction
- Similar cycles tended to precede weak returns for the index, especially over the following 2-3 months
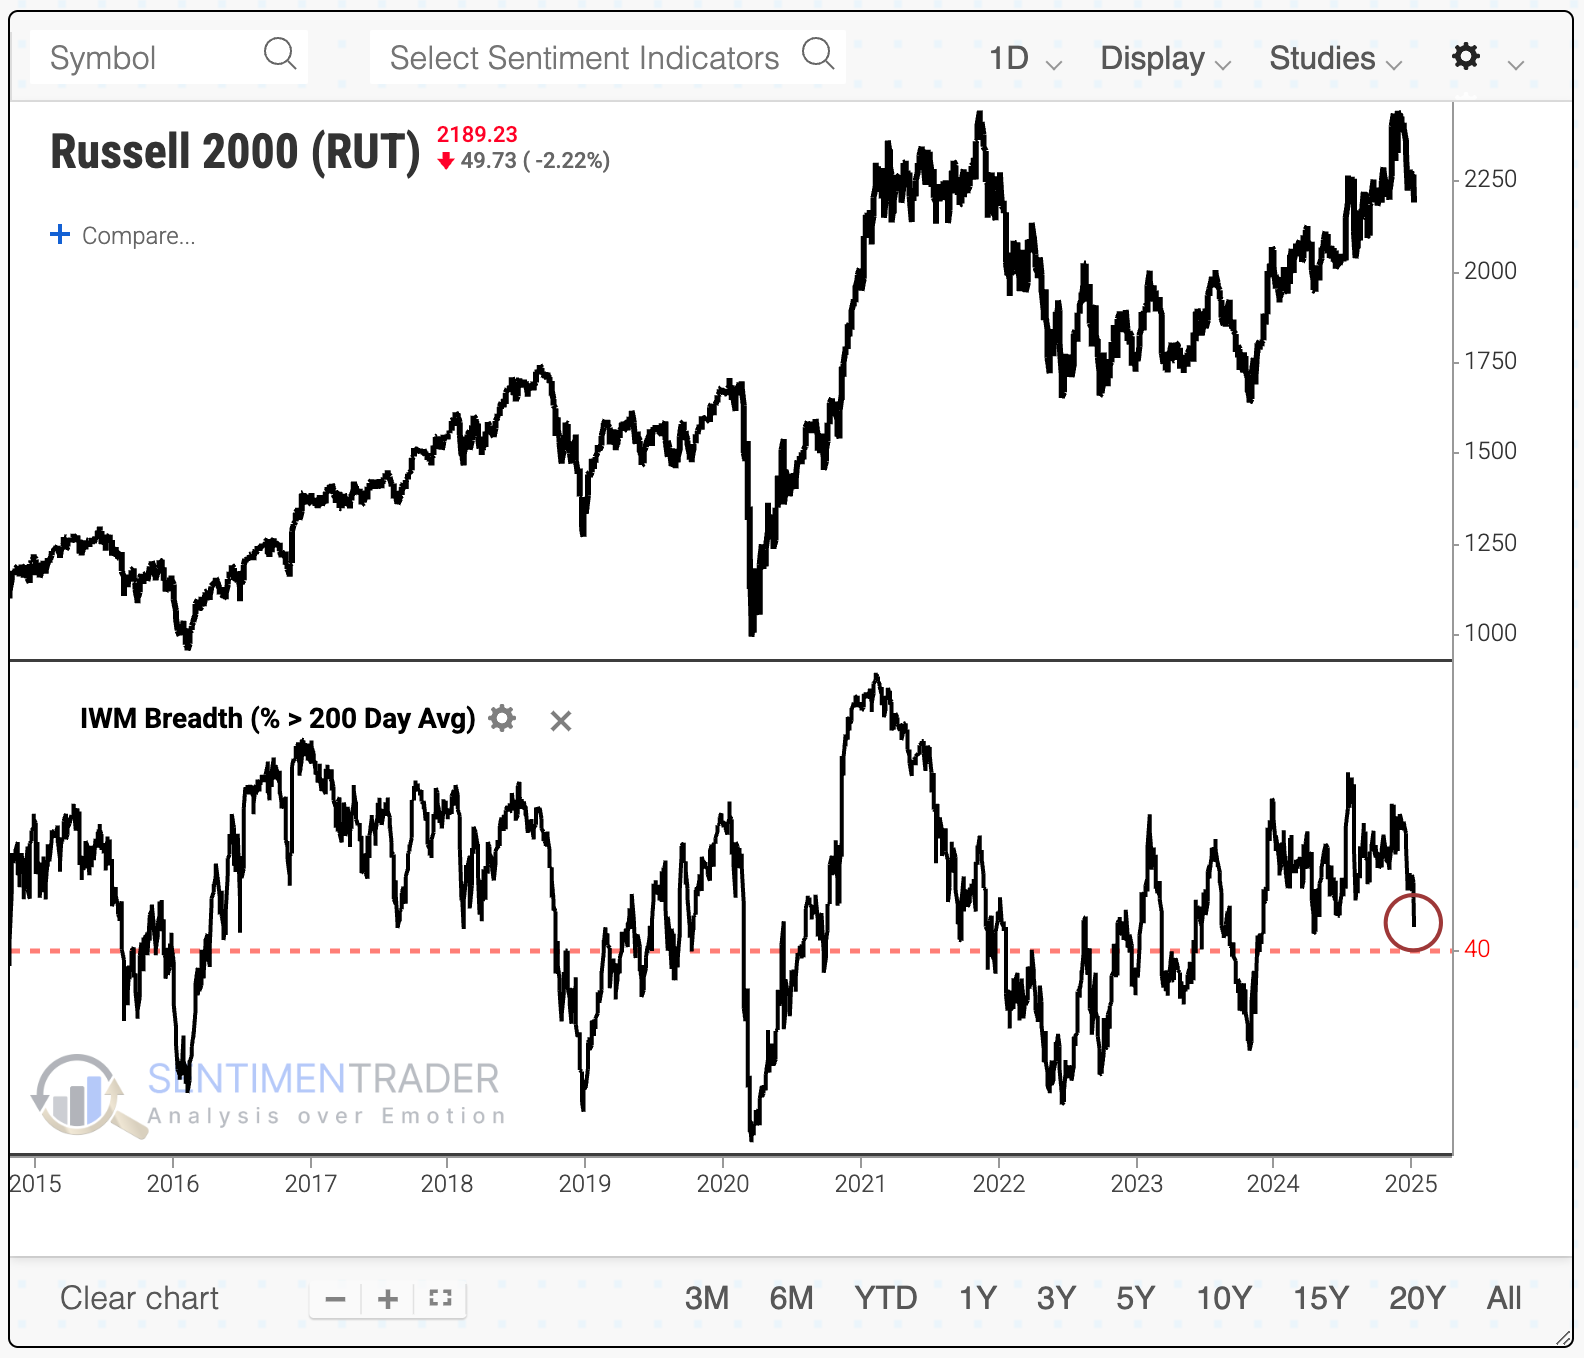
- One caveat to the bearish action is that more than 40% of stocks are still holding above their 200-day averages
Back into a correction
Small stocks were supposed to be the biggest beneficiaries during the new administration. It brought hope to a long-suffering investor base, but the rug has been pulled again. The small-cap Russell 2000 is the first of the major indices to fall into correction territory.
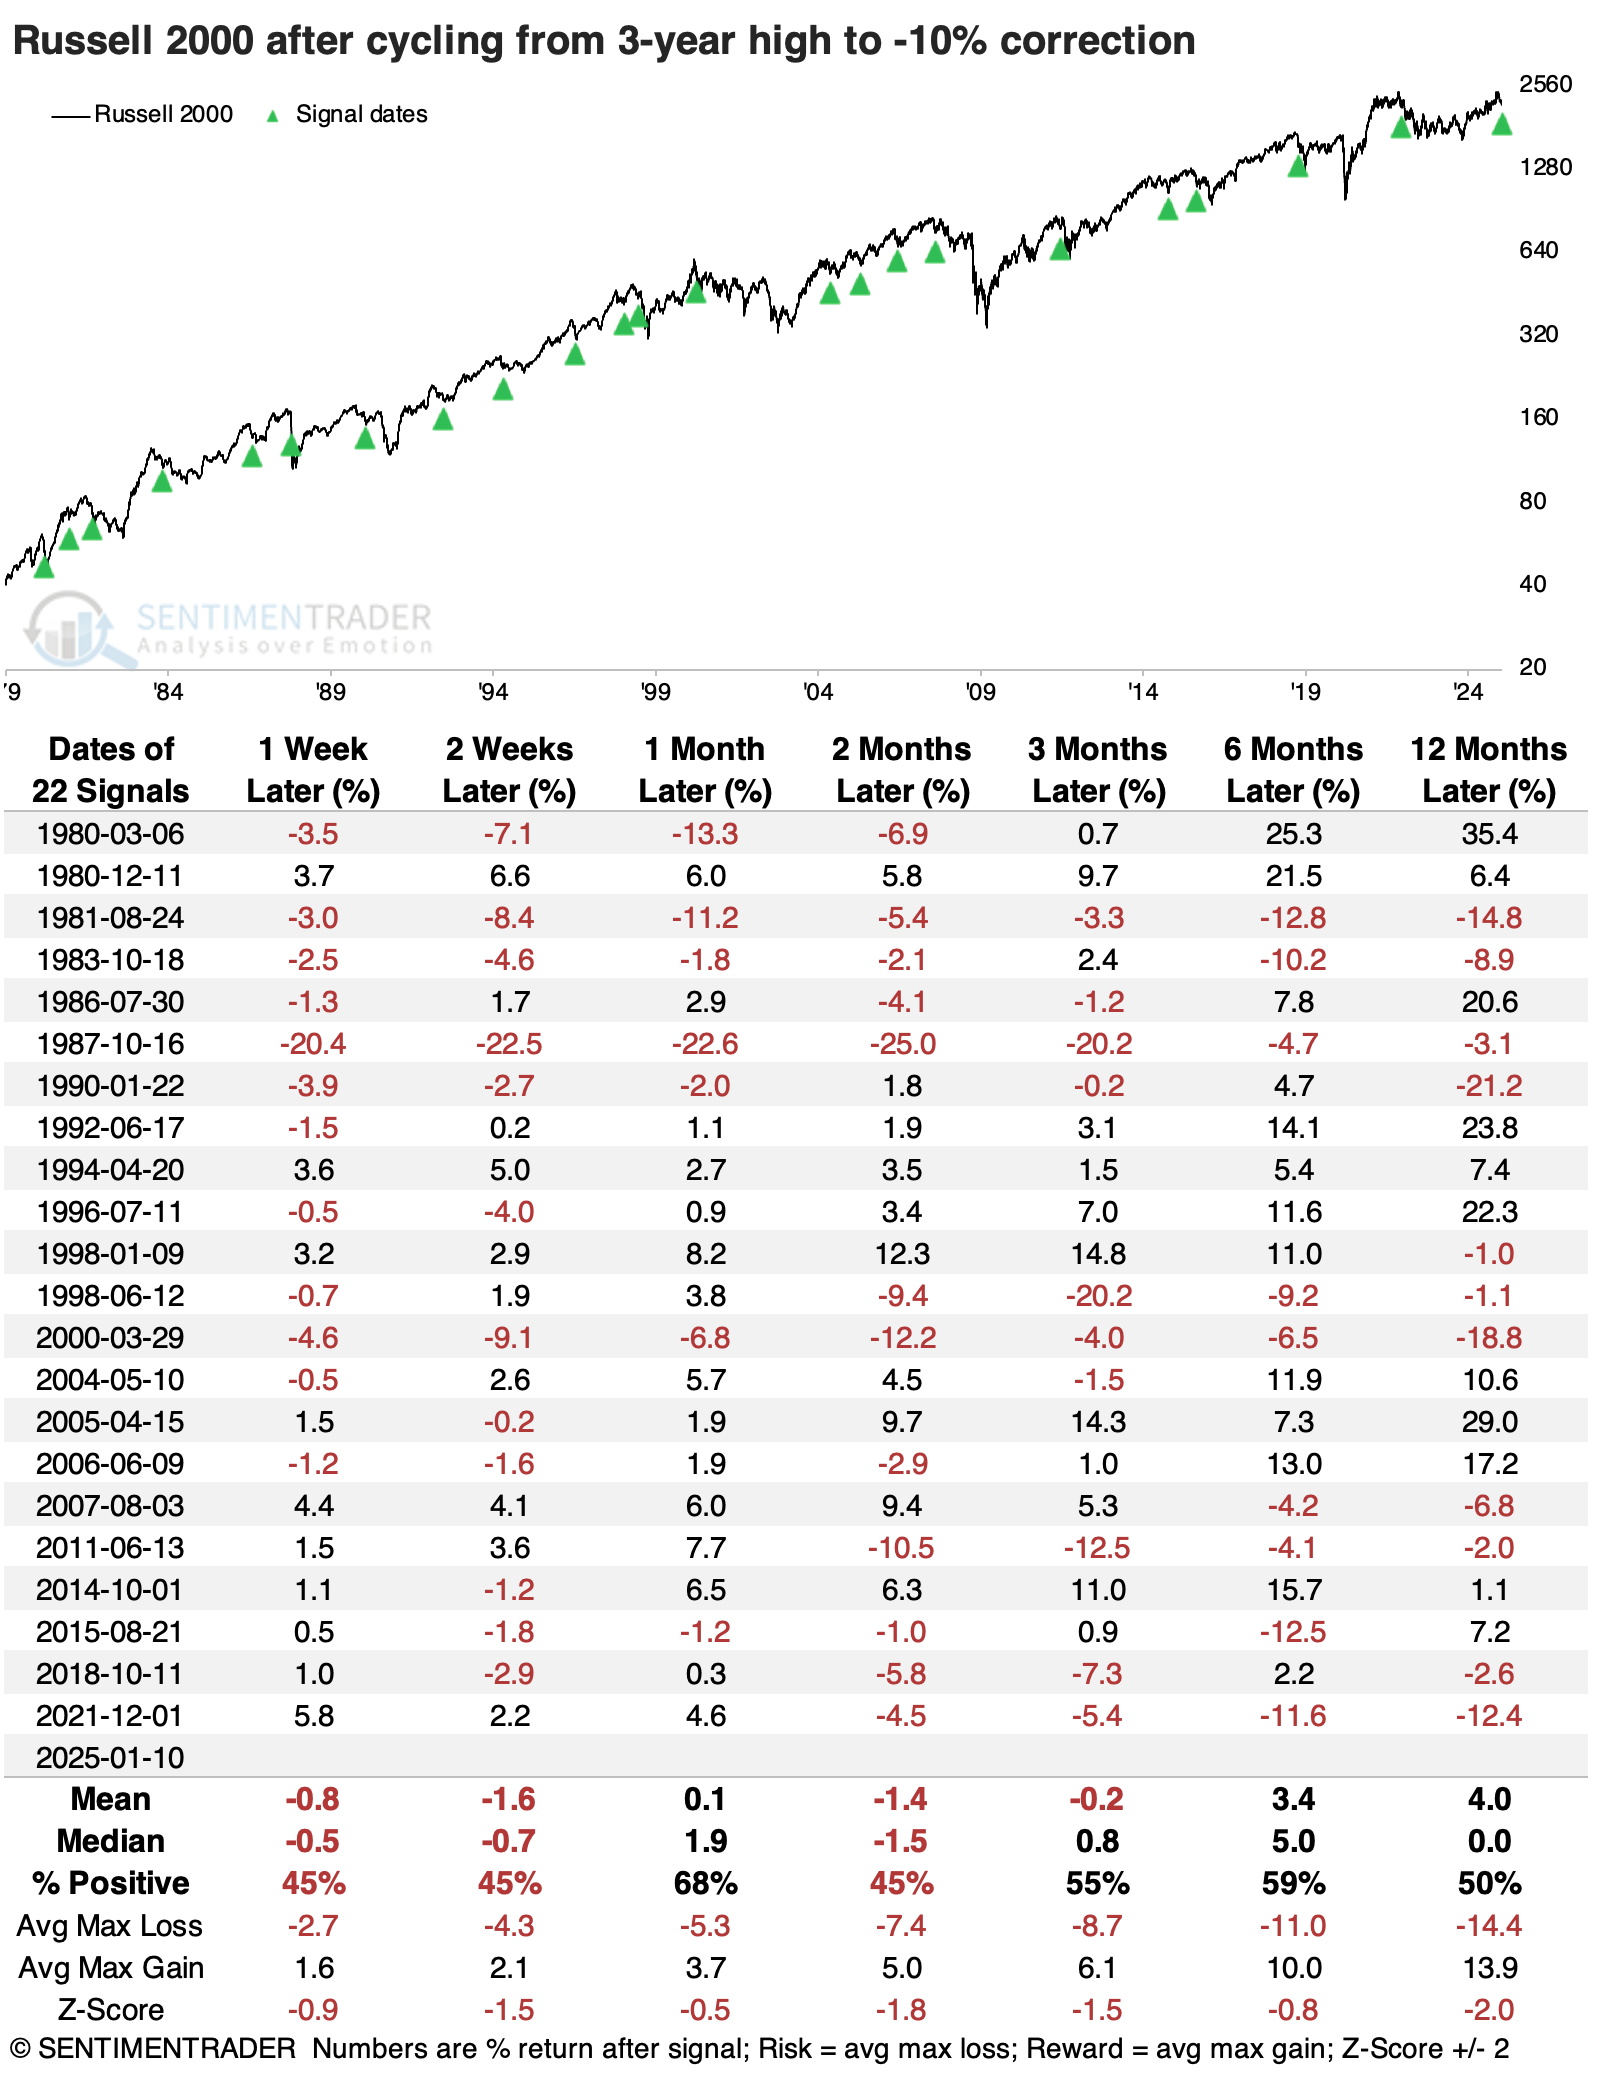
It has not been a great sign for the index. The last three times it cycled from a multi-year high to correction territory preceded more weakness in the months ahead.
The table below shows all new-high-to-correction cycles since the Russell 2000's inception in 1978. Its returns afterward were well below average, with some hefty losses and a smattering of large rebounds. The overall risk/reward proposition was poor; over the following year, the average risk was -14.4% compared to an average reward of +13.9%.
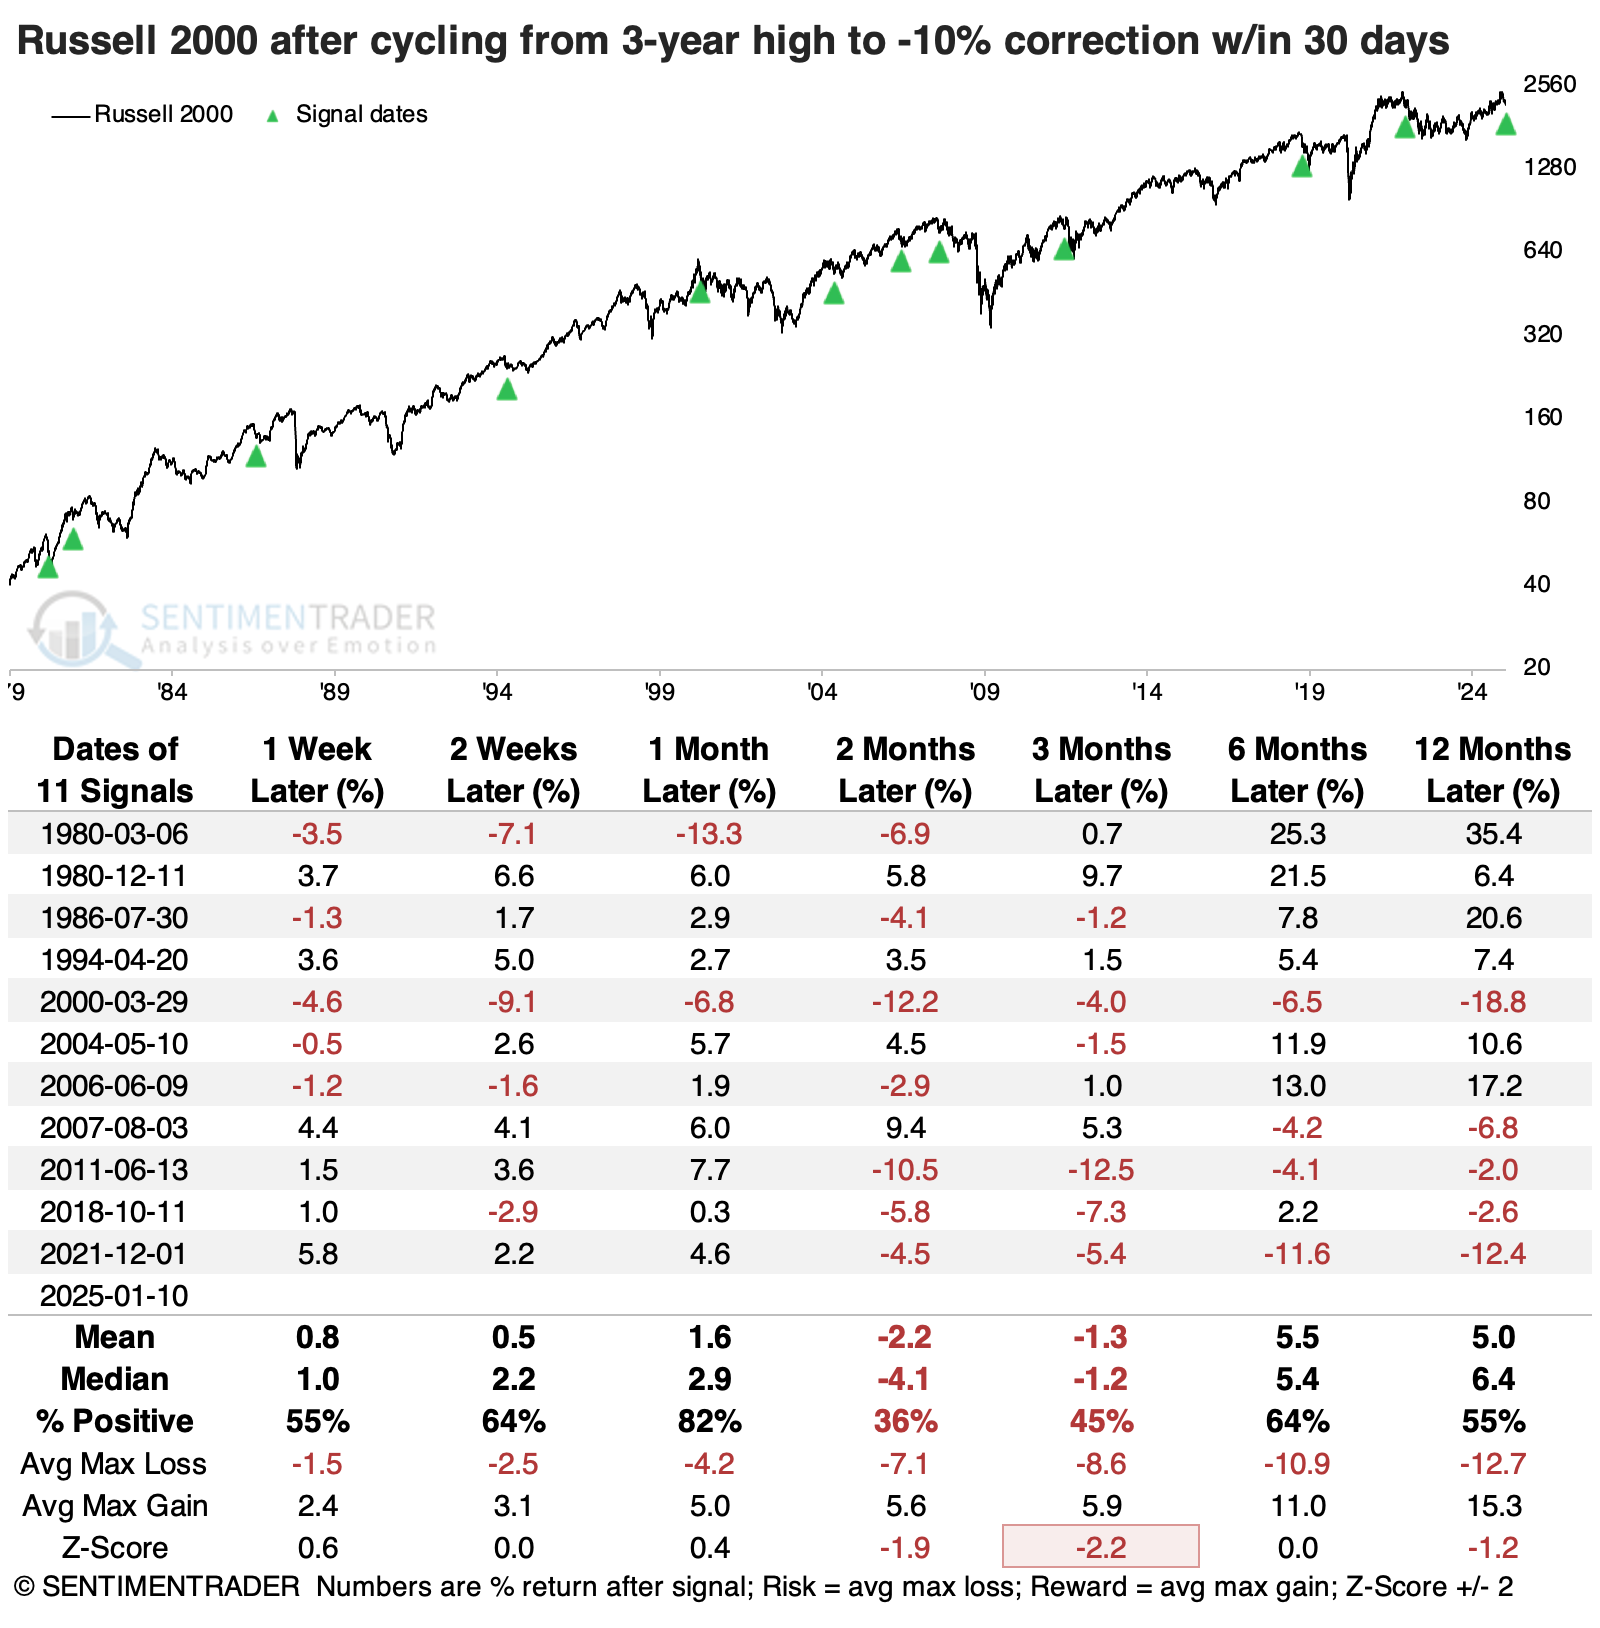
The current one has been a quick reversal, cycling from a new high to a -10% pullback in only 30 trading days. Quick reversals have been a bit of a worse sign over the medium term but a better sign in the longer term, though the last four signals all led to a negative one-year return. Only three of the eleven signals avoided a loss either two or three months later.
Uptrends are still holding up among small-cap stocks
It might be notable that the average stock in the index isn't faring terribly, with more than 40% of stocks in the Russell 2000 still holding above their 200-day moving average.
We generally consider the 40% threshold to be the delineator between healthy and unhealthy markets. If more than 40% of stocks hold above their long-term averages during pullbacks, the bull market tends to resolve to the upside, and if it dips below 40%, buyers typically step in right away. The worst losses tend to cluster when consistently fewer than 40% of stocks remain in uptrends.
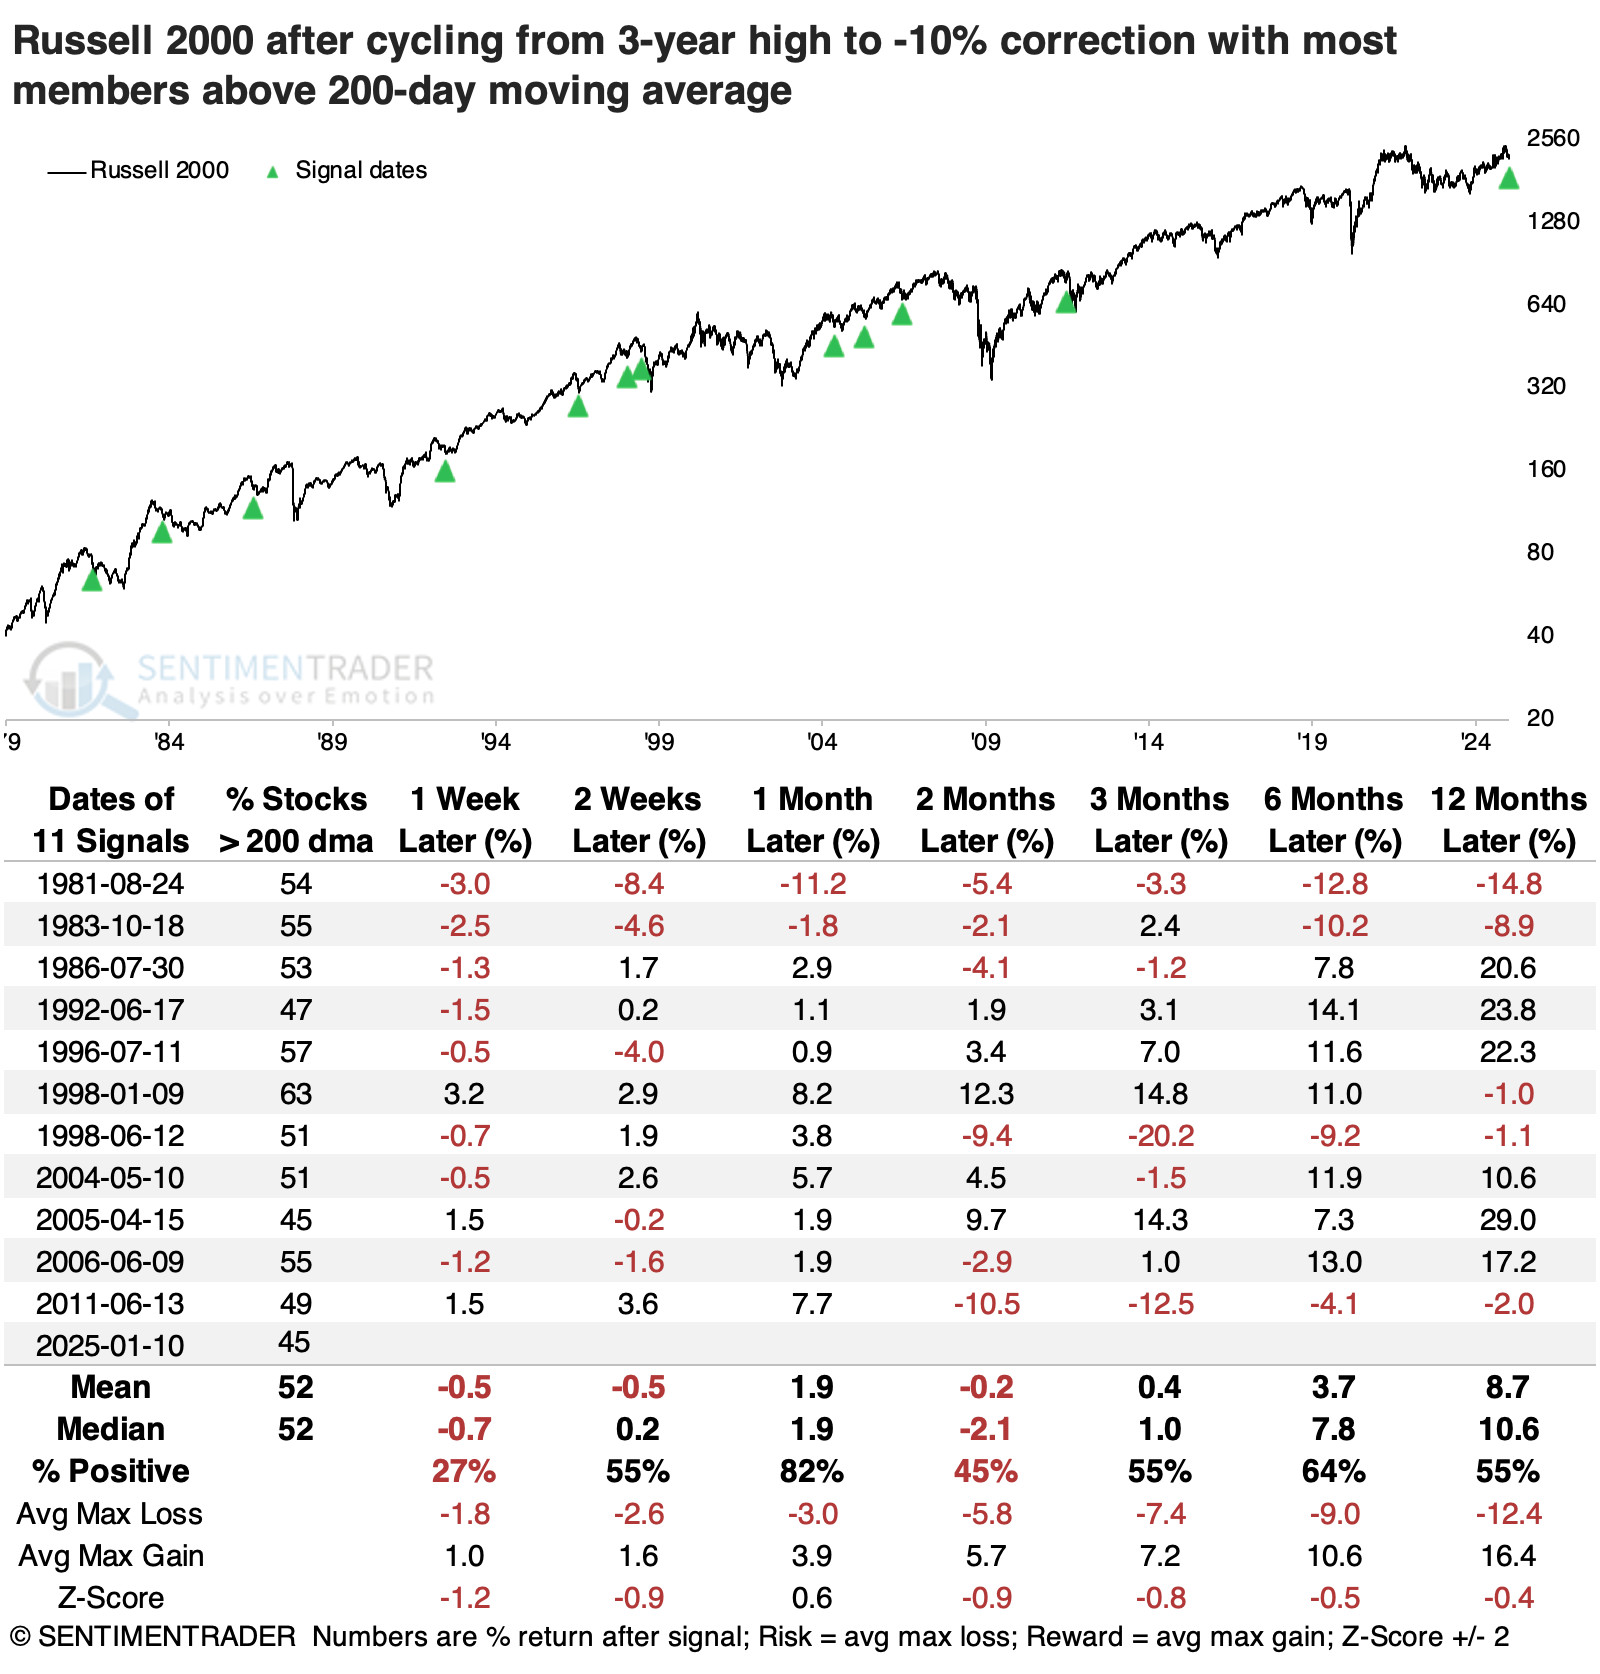
The table below shows the new-high-to-correction cycles in the small-cap index, but it is filtered for those signals with the most stocks above their 200-day moving averages. Returns still weren't great, but the Russell 2000 mostly avoided the worst losses. Over the following year, the index only suffered one double-digit loss versus six double-digit gains.
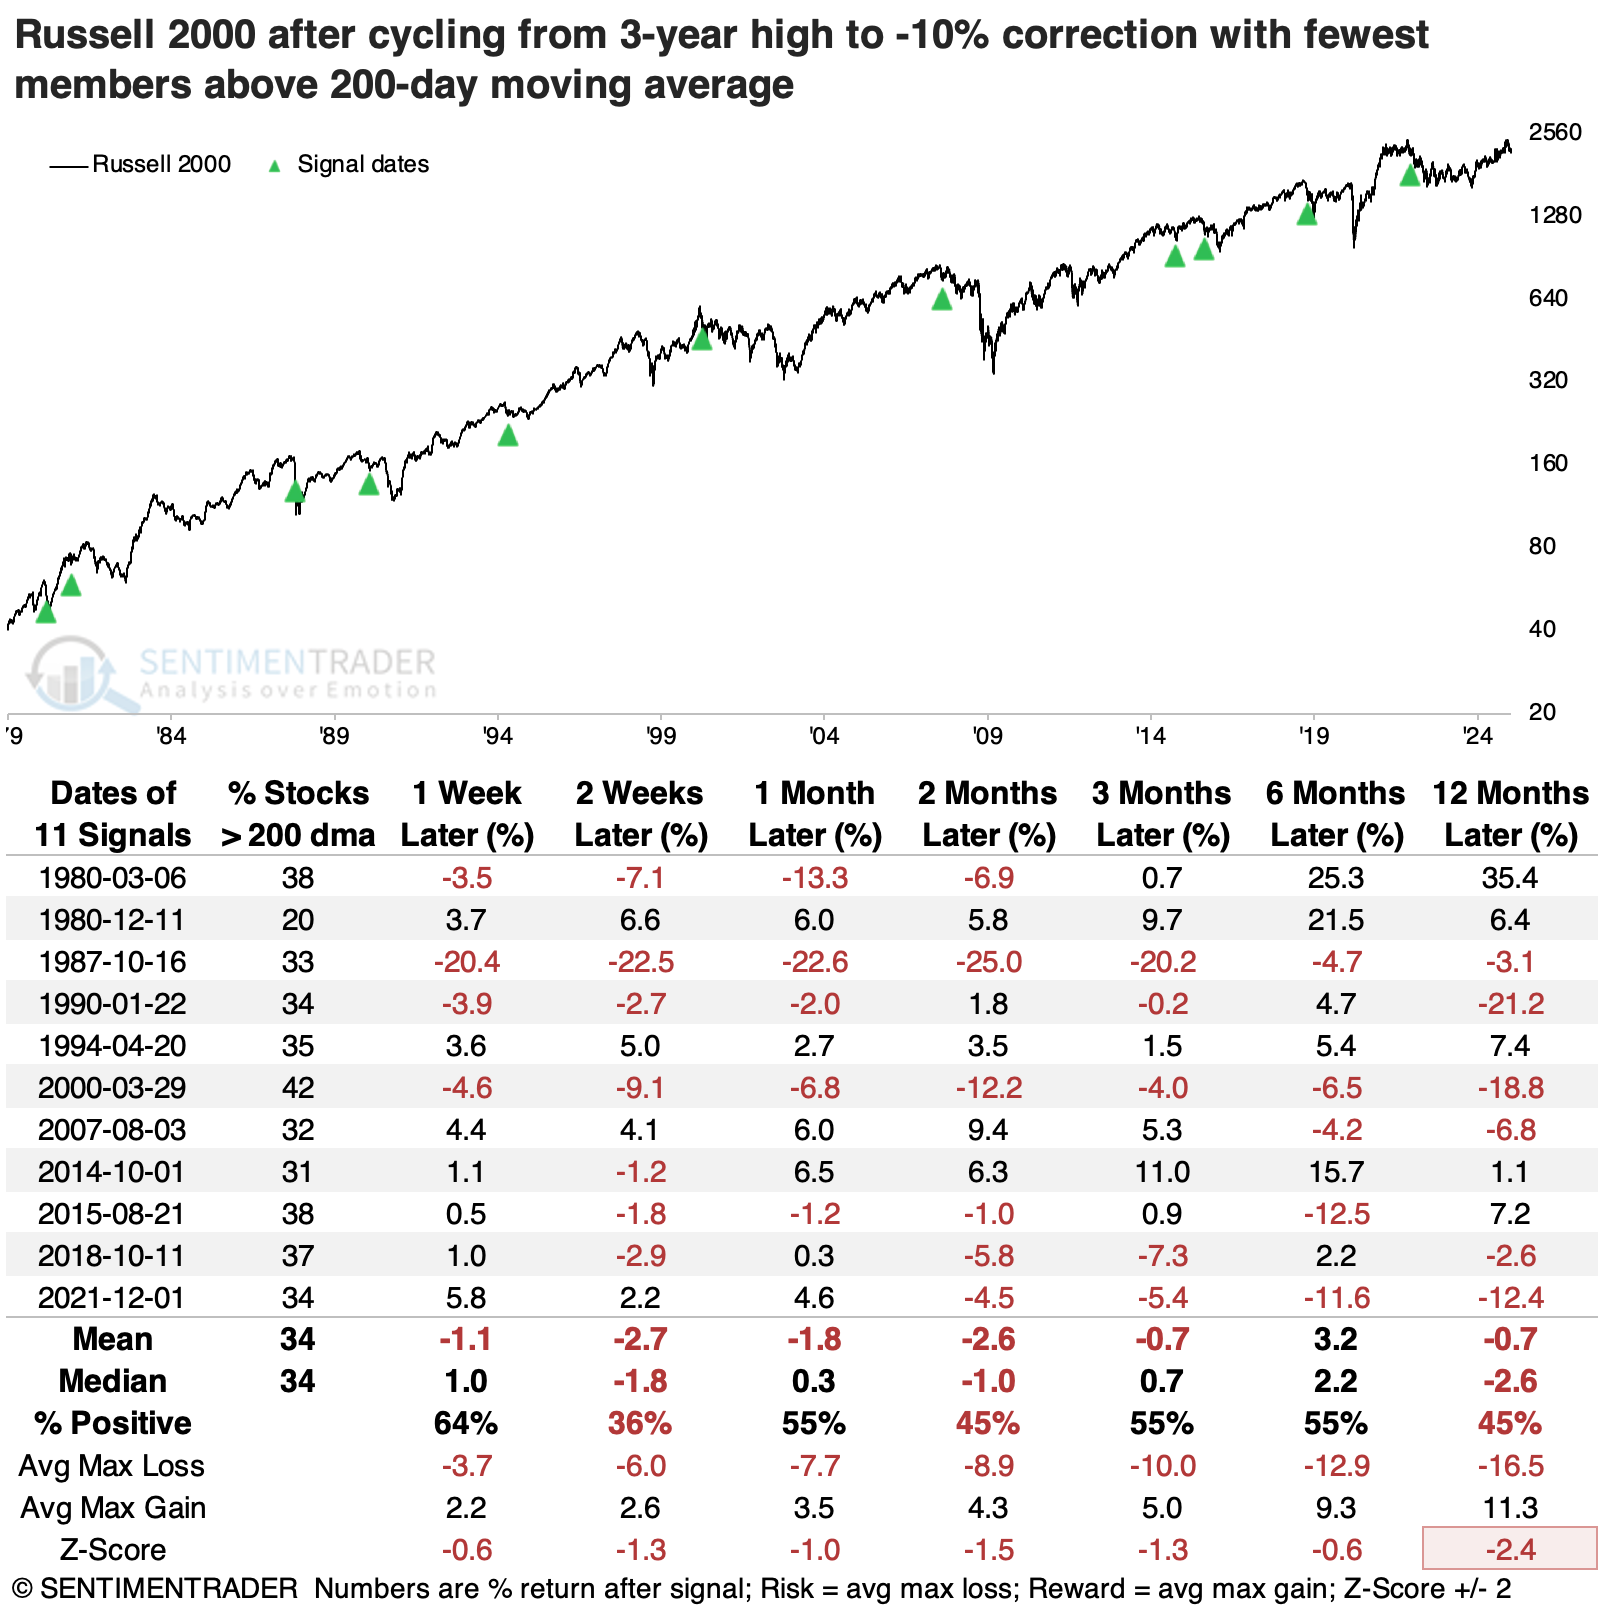
Compare those returns to correction cycles that had the fewest stocks above their 200-day averages on the day the Russell fell into a correction. After these signals, there were three double-digit losses a year later and only one double-digit gain.
What the research tells us...
It's nice when everything lines up. While nothing is ever a sure thing in auction markets, it does help our confidence level when different indicators and studies mostly align with a likely direction. We don't have that here.
When the small-cap Russell 2000 has fallen into a correction from a multi-year high, the index has shown a pretty consistent tendency to keep falling, especially within the next few months. However, one caveat to becoming overly bearish on the index is that an above-average number of small-cap stocks still hold above their long-term averages. That has tended to lessen future losses, tilting the playing field more toward bulls, especially over longer time frames like one year.