
Small caps day in the sun approaches but patience remains in order

Key Points
- Small caps have underperformed larger stocks for many years
- The tide may be beginning to turn in favor of small caps
- Several breadth indicators suggest impending strength for small caps
- Still, the history of the indicators and seasonality suggests that investors remain patient for now
IWM versus SPY
The chart below (courtesy of StockCharts) displays the performance of ticker IWM (iShares Russell 2000 ETF) versus the performance of ticker SPY (SPDR S&P 500 ETF) over the past five years.
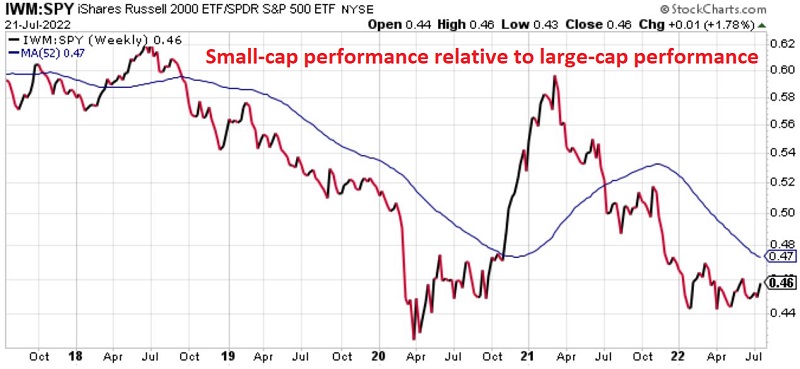
Small caps significantly underperformed into March 2020. Then they outperformed for 12 months before plunging once again (on a relative basis) into early 2022. Where this line moves from here is anyone's guess. Still, many investors seem to be anticipating another thrust to the upside - i.e., a period of significant outperformance on the part of small caps.
The bottom line: A bullish relative trend may be forming - but it is far too soon to know.
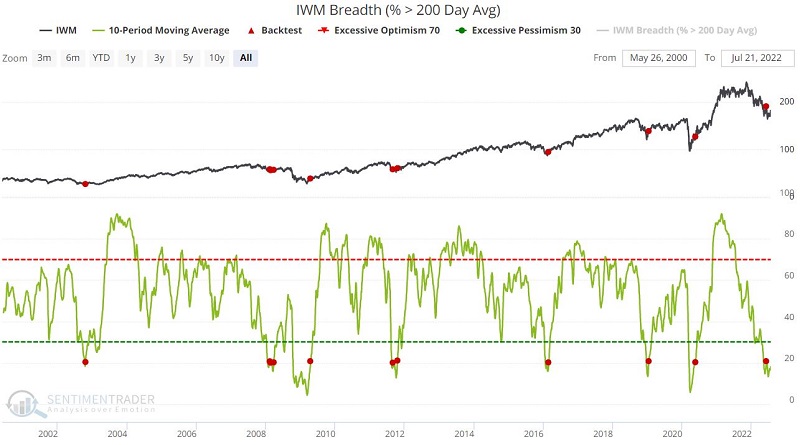
IWM Breadth (200-day Avg)
The chart below displays all days since mid-2020 when the 10-day average of IWM component stocks above their 200-day moving average was below 20. The table below the graph shows a summary of IWM performance following these days.
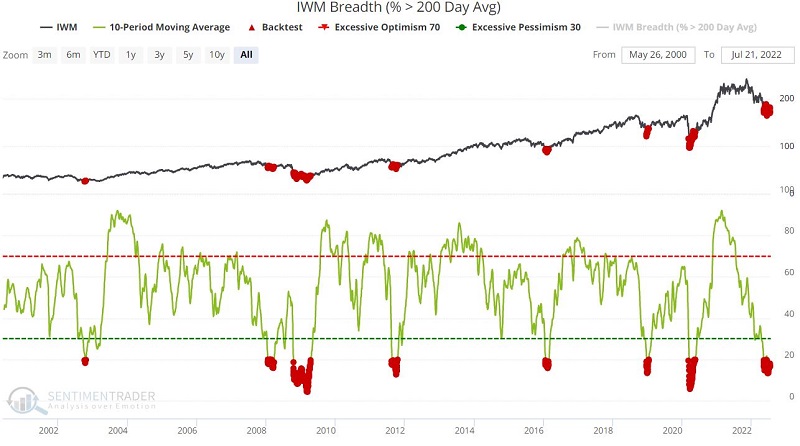
In most cases, the initial drop by this indicator below 20 did not market the exact bottom. However, the bottom typically occurred during a string of below 20 readings. Most recently, the 10-day average of IWM stocks below their 200-day average dropped below 20 on 5/9/2022, then popped back above 20 on 6/7/2022 (and then fell back below 20).
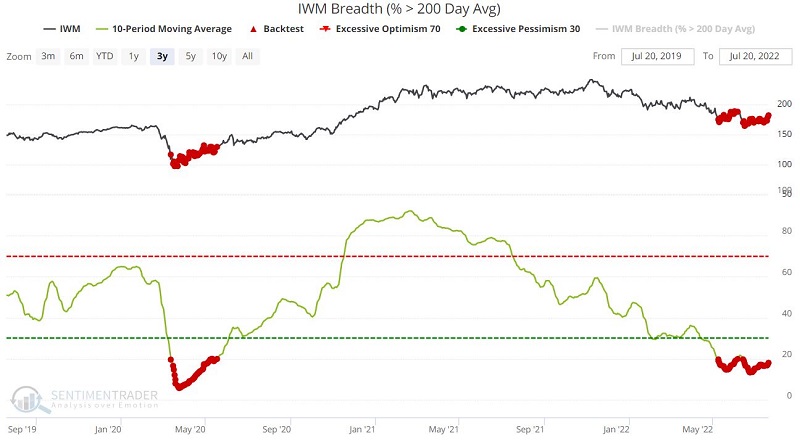
The chart below displays both the 2020 and 2022 sub-20 periods.
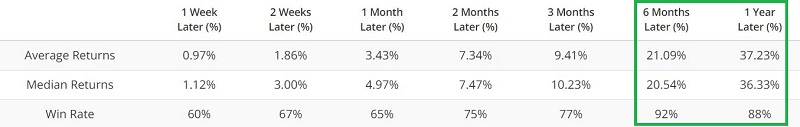
Simply waiting for the 10-day average of this indicator to rise back above 20 may be the best play for patient small cap investors. The chart and table below display those days when the 10-day average rose back above 20 and IWM performance results. Note that both 3-month and 6-month holding periods showed a gain 100% of the time.
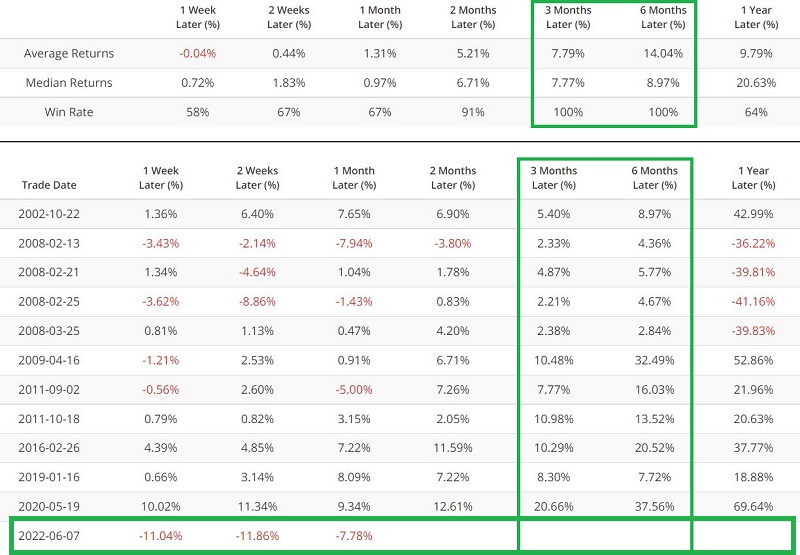
One word of caution: So far, the 6/7/2022 signal has shown some pretty dreadful results. The only other time this happened following a signal was in February 2008. Still, even in those cases, the 3-month and 6-month holding periods managed to show a gain.
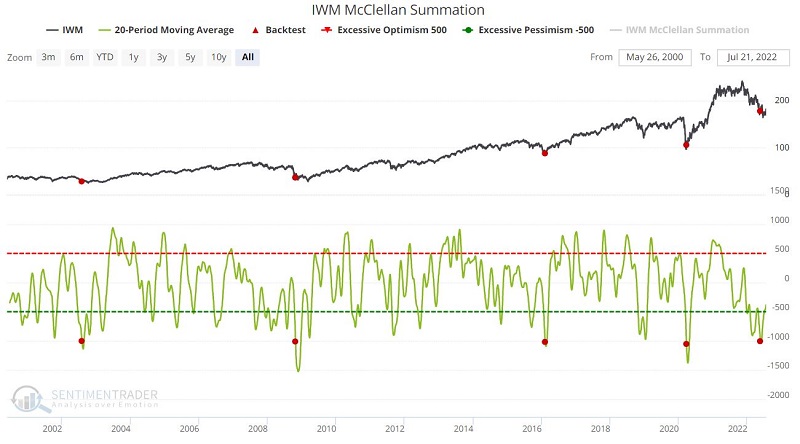
IWM McClellan Summation Index
The chart and table below display those times when the IWM McLellan Summation Index 20-day moving average crossed below -1000 for the first time in six months and the subsequent performance for ticker IWM.
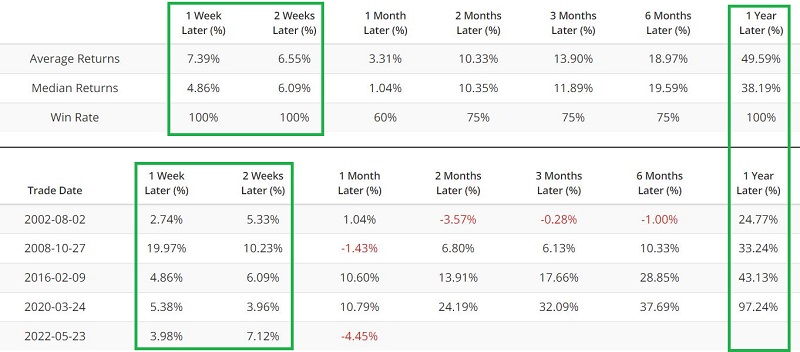
We are looking at a small sample size (four previous signals since 2000), so it is risky to draw conclusions. Nevertheless, it is interesting to note that 1-week, 2-week, and 12-month returns showed a Win Rate of 100%, and the 12-month returns following the four previous signals were nothing short of spectacular (Median return = +38.19%).
The latest signal occurred on 5/23/2022.
The historical results for the two indicators above suggest the potential for robust small-cap performance in the year ahead. However, there is at least one reason to consider holding off jumping on the bandwagon for a bit longer.
RUT Seasonality
The chart below displays the annual seasonal trend for ticker RUT (Russell 2000 Index, the index that IWM tracks). Note we have just entered a period of seasonal weakness. This period extends from Trading Day of the Year #137 through TDY # 155. For 2022 this period extends from the close on 7/20/2022 through the close on 8/15/2022. There is another even more severe period of seasonal weakness from September into October.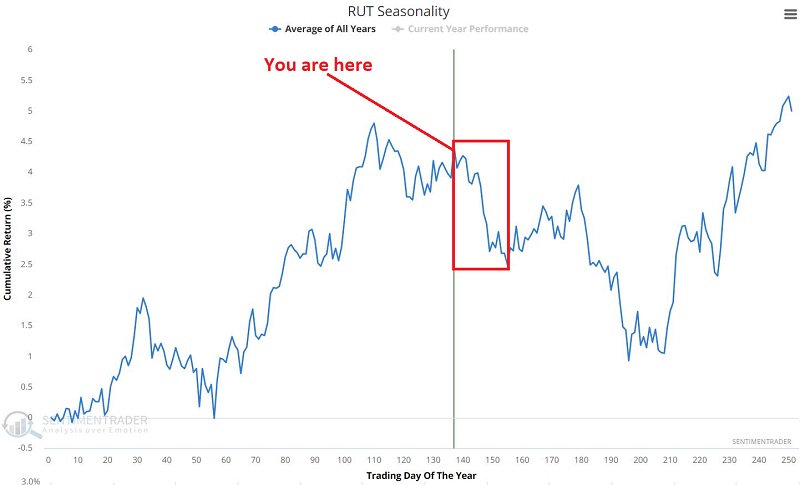
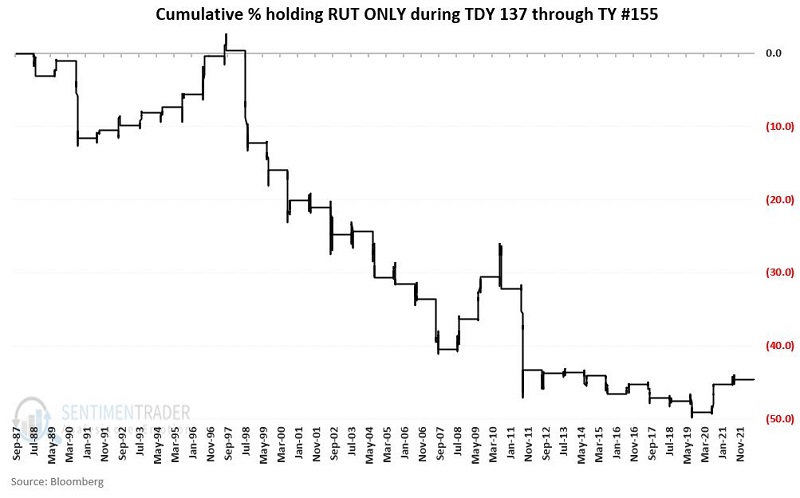
The chart below displays the cumulative % return for RUT only during this period every year since 1988.
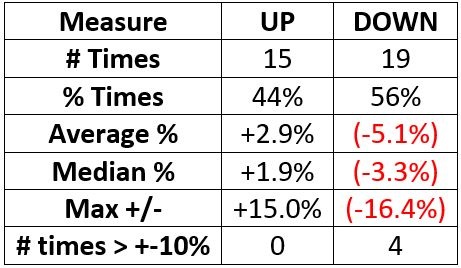
The table below summarizes performance during this seasonally unfavorable period.
What the research tells us…
No sector, factor, market, or index ever has a permanent advantage over any other. Over many decades, small-cap stocks have vastly outperformed large-cap stocks. However, small caps have significantly underperformed in the past decade or so. Like Yin follows Yang, ultimately, this will change, and small caps will once again have their "day in the sun." Several indicators above suggest that small caps may be poised for a strong rally in the next 9-12 months. However, jumping in heavily now to small caps appears a bit premature, given a) the historical tendency for some serious seasonal weakness between now and mid-October and b) the still lackluster nature of the small-cap/large-cap relationship.
Nevertheless, investors should pay close attention to small caps in the weeks and months ahead as the potential for a reversal of fortune appears higher than it has been in some time.