Products
SentimenTrader Trading Tools
‍
Backtest Engine
My Trading Toolkit
Correlation Analysis
Seasonality
Market Prediction
Indicators & Data API
‍
Proprietary Indicators & Charts
Market Data API
Strategies & Scanner
‍
50+ Trading Strategies
Smart Stock Scanner
Smart Option Scanner
Research Reports
‍
Research Solutions
Reports Library
Free Resources
Simple Backtest Calculator
Simple Seasonality Calculator
The Kelly Criterion Calculator
Sentiment Geo Map
Public Research Reports
Education
Sentiment Indicators
Technical Indicators
Pricing
Company
About
In the News
Testimonials
Client Success Stories
Contact
Log inLoginSign up
< BACK TO ALL REPORTS

Small-Cap vs Large-Cap Performance

by Sentimentrader
2026-01-15
A trading model tracking small vs large-cap relative performance triggered a bullish reversal signal. The sharp shift higher in small-cap relative strength bodes well for broad market trends, with robust win rates across all time horizons.

Key points:

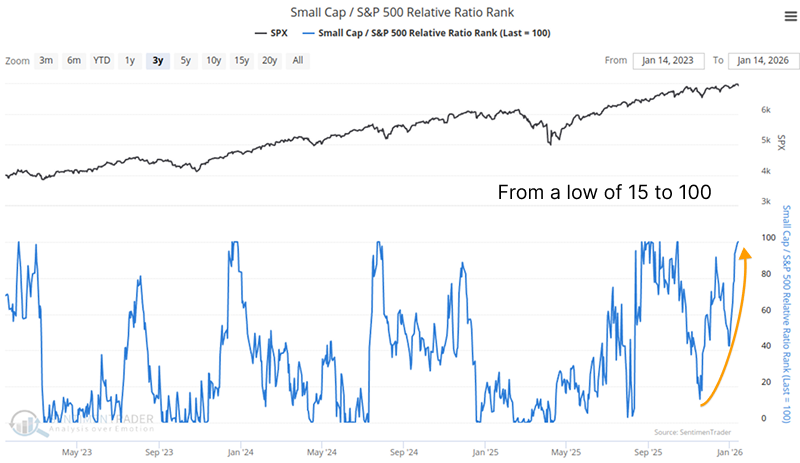
  • The ratio of small-cap stocks to large-cap stocks has surged to the highest level within its recent range
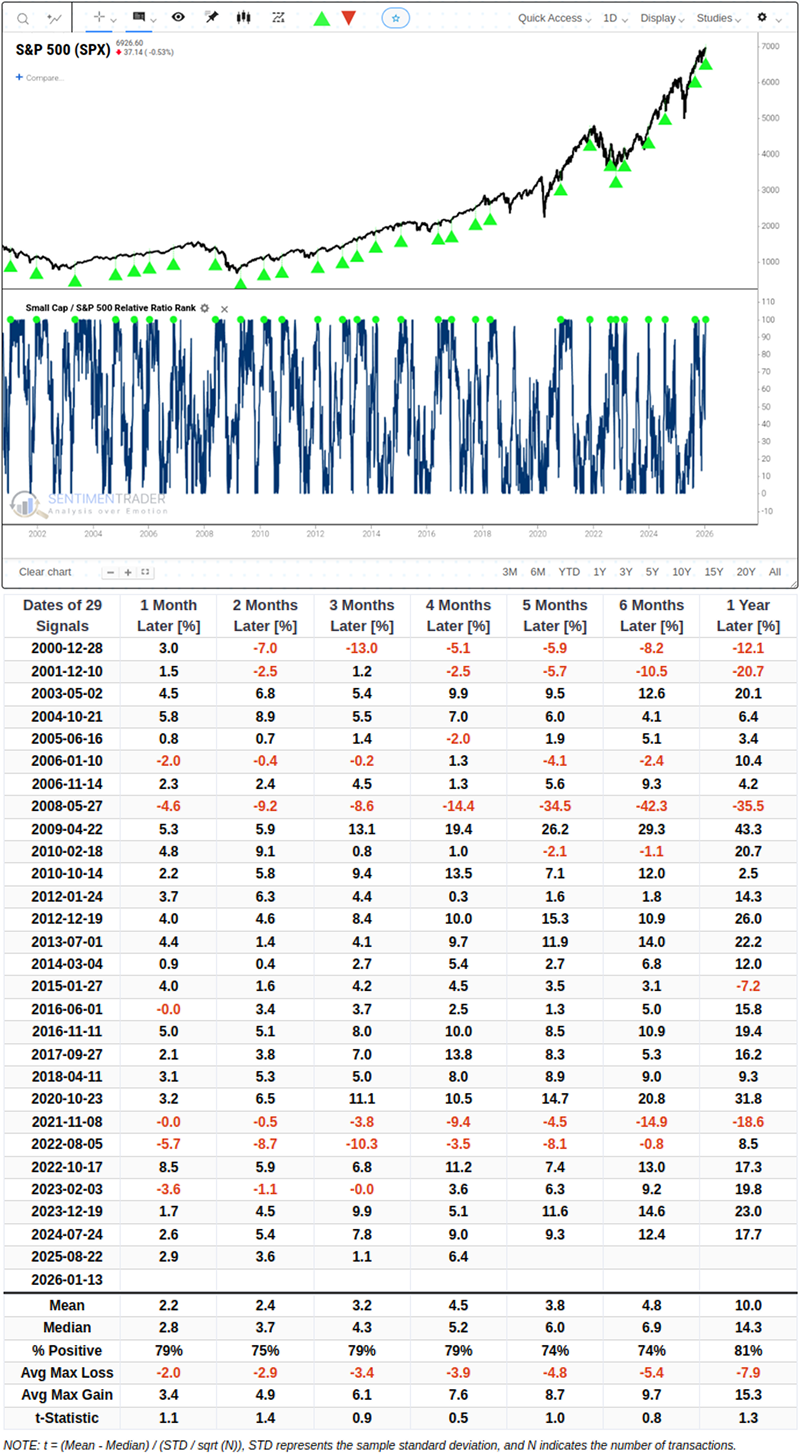
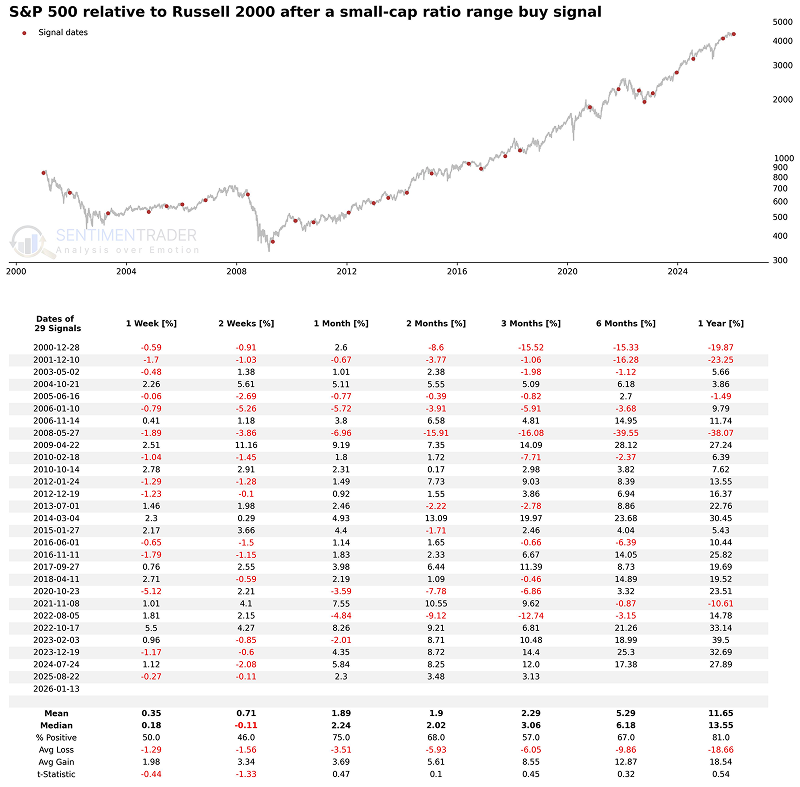
  • After the signal triggers, large-cap stocks have a 81% probability of rising over the subsequent 12 months
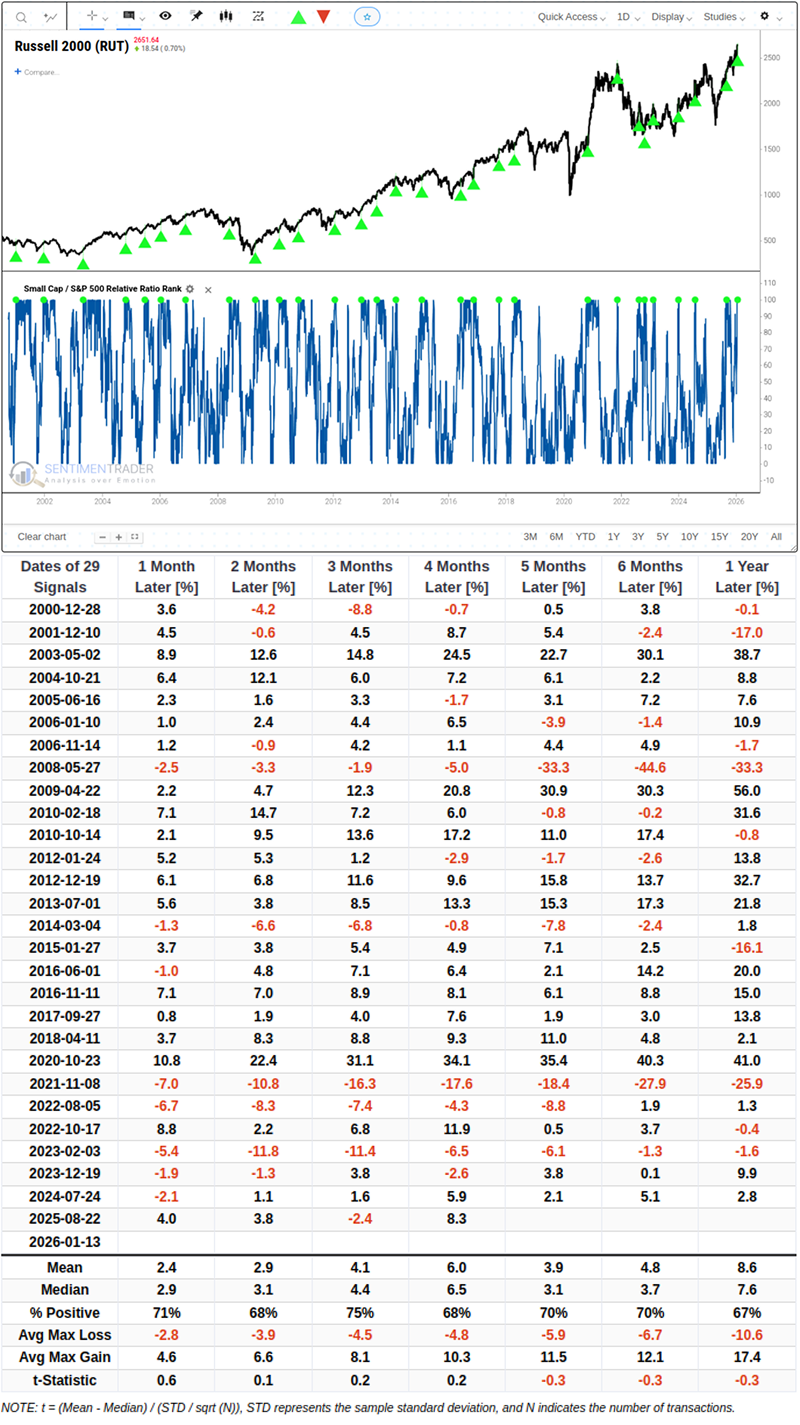
  • After the signal triggers, small-cap stocks have posted gains over the subsequent 3 months 75% of the time

Economically-sensitive small-cap stocks as a broad market risk appetite barometer 

From November 20, 2025, to January 14, 2026, the Russell 2000 Index has rallied sharply by 15.0%, while the S&P 500 Index gained 5.9% over the same period. This standout performance from small-cap stocks is encouraging. Nevertheless, historical data serves as a caution: small-caps typically underperform large-caps in the aftermath of such sharp short-term price surges.

We track the relative performance ranking of small-cap and large-cap stocks through a dedicated metric - the Small Cap/S&P 500 Relative Ratio Rank. Recently, the 4-month range rank of the small-cap vs large-cap ratio has reversed sharply, moving from below 15% to 100%.

The S&P 500 Index has risen over the next 12 months 81% of the time

This signal has been triggered a total of 29 times over the past 25 years. Historically of the signal activation, large-cap stocks delivered strong performance across all time horizons, with multiple meaningful risk/reward characteristics. While the overall track record is solid, investors should note that during major systemic downtrends, the signal did not prevent absolute losses for either index. This suggests the signal requires a supportive macro environment to be effective.

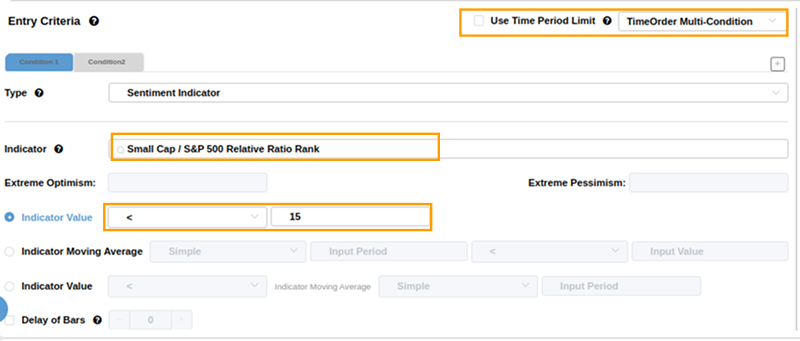
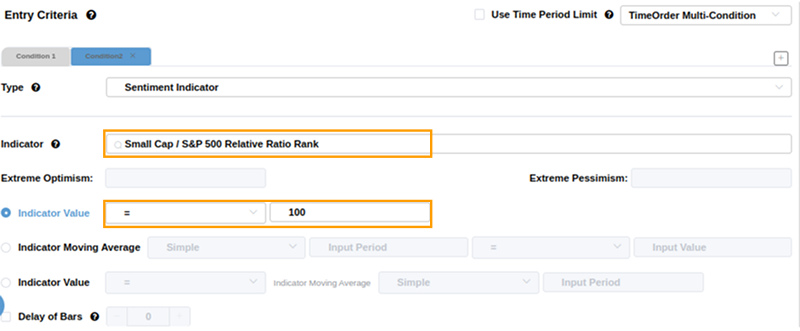
You can create a backtest with identical conditions in our BacktestEdge by following these steps:

The Russell 2000 Index has risen over the next 3 months 75% of the time

Small-cap stocks have also demonstrated strong performance, with sound risk/reward ratios across all time frames. However, considering the Historical Win Rates after 1 year (81% vs 67%), Large-cap stocks appear to maintain a consistency advantage over the medium to long term. Investors should favor Large-caps (S&P 500) for higher probability of positive returns.Related Backtest Click Here.

Small-Cap Performance Tends to Lag Behind Large-Caps

Based on the net return spread between the S&P 500 Index and the Russell 2000 Index, forward-looking tables indicate a more favorable market landscape for large-cap stocks over the medium to long term.

What the research tells us...

When small-cap relative performance reverses from underperformance to outperformance and triggers this reversal signal, historical data offers us a unique perspective. Similar market conditions observed today have historically driven upside momentum in both the S&P 500 and Russell 2000 Indices, with robust risk/reward profiles across medium and long-term timeframes. Large-cap stocks appear to maintain a consistent advantage when this signal is triggered - offering superior risk-adjusted returns over the full cycle.

PRODUCTS
SentimenTrader
Trading Tools
Indicators & Data API
‍
Strategies & Scanner
‍
Research Reports
FREE
RESOUrCES
Simple Backtest
Calculator
Simple Seasonality
Calculator
The Kelly Criterion
Calculator
Sentiment Geo Map
‍
Public Research Reports
‍
Education
Sentiment Indicators
‍
Technical Indicators
‍
Pricing
Bundle pricing
‍
FAQ
‍
Announcements
‍
COMPANY
‍
About
‍
In the News
‍
Testimonials
‍
Client Success Stories
CONTACT
‍
General Inquiries
‍
Media Inquiries
‍
Financial Professionals Inquiries
‍
© 2026 Sundial Capital Research Inc. All rights reserved.
Setsail Marketing
TermsPrivacyAffiliate Program
Risk Disclosure: The information and tools provided are for research and analytical purposes only and are not intended as investment advice. Market analysis involves uncertainty, and outcomes may differ from expectations. Users should conduct their own due diligence and consider their individual circumstances before making any financial decisions. Past performance is not necessarily indicative of future results.

Hypothetical Performance Disclosure: Hypothetical performance results have many inherent limitations, some of which are described below. No representation is being made that any account will or is likely to achieve profits or losses similar to those shown; in fact, there are frequently sharp differences between hypothetical performance results and the actual results subsequently achieved by any particular trading program. One of the limitations of hypothetical performance results is that they are generally prepared with the benefit of hindsight. In addition, hypothetical trading does not involve financial risk, and no hypothetical trading record can completely account for the impact of financial risk of actual trading. for example, the ability to withstand losses or to adhere to a particular trading program in spite of trading losses are material points which can also adversely affect actual trading results. There are numerous other factors related to the markets in general or to the implementation of any specific trading program which cannot be fully accounted for in the preparation of hypothetical performance results and all which can adversely affect trading results.

Testimonial Disclosure: Testimonials appearing on this website may not be representative of other clients or customers and is not a guarantee of future performance or success.