
Small-cap versus Large-cap nears an important date

Key Points
- Small caps will soon enter their most favorable seasonal period of the year
- A particular window from mid-December into mid-February has tended to witness outperformance by small-cap stocks
- Large-cap stocks have historically dominated the rest of the year.
Test Periods and Data
We will focus on two seasonal periods, one favoring small-caps and the other large-caps.
- Period #1 extends from the close on the 11th trading day of December through the close on the 11th trading day of February. This period tends to favor small-caps.
- Period #2 extends from the close on the 11th trading day of February through the close on the 11th trading day of December. This period tends to favor large caps.
NOTE: The next Period #1 will begin at the close of trading on 2024-12-16 and will extend through the close on 2025-02-18.
Our test will focus on the post-World War II era, starting on the 11th trading day of December 1945. We will use the Fama French small-cap and large-cap indexes from 1945 to 1991 and then the S&P small-cap and large-cap index after that. Our historical test period extends from 1945-12-13 through 2024-11-29.
Test Period #1: Favoring Small Caps mid-December to mid-February
The chart below displays the growth of $1 invested in small-caps (black line) versus $1 invested in large-caps (blue line) only from the close on the 11th trading day of December through the close on the 11th trading day of February, every year starting in 1945.
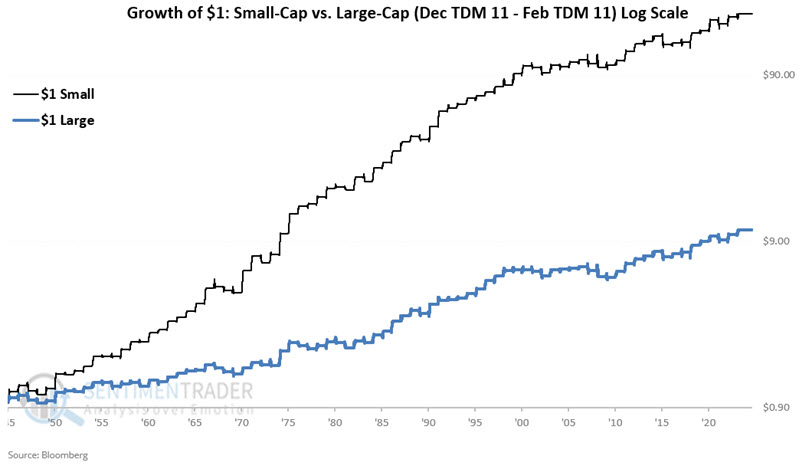
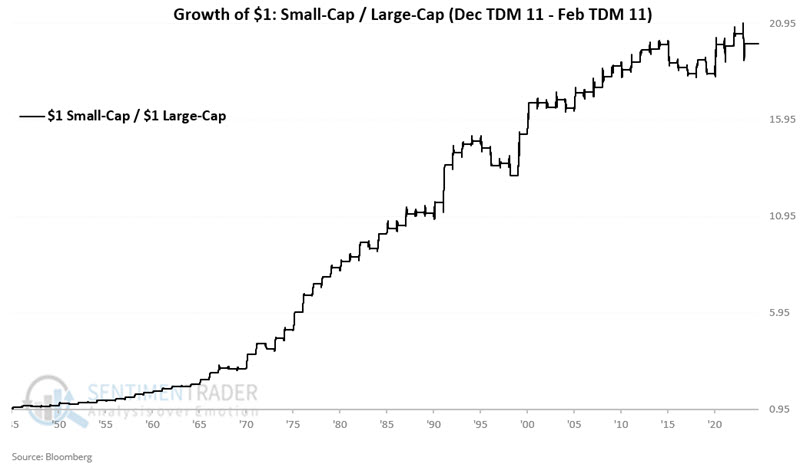
$1 in small caps grew to $211 (+20,994%), versus $1 in large caps, which increased to $10.59 (+959%). The chart below divides the growth of $1 in small caps by the growth of $1 in large caps from mid-December into mid-February.
The table below compares small-cap versus large-cap performance from Dec TDM 11 through Feb TDM 11 since 1945.
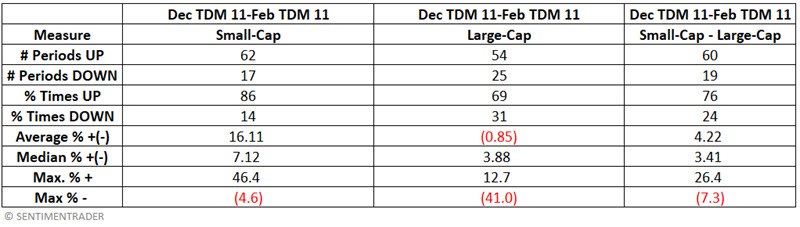
Some key things to note - Small-caps:
- Showed a gain 86% of the time (versus 69% for Large-caps)
- Outperformed large caps 76% of the time
- Showed a Median Gain of +7.12% (versus +3.88% for Large-caps)
Test Period #2: Favoring Large Caps mid-February to mid-December
The chart below displays the growth of $1 invested in small-caps (black line) versus $1 invested in large-caps (blue line) only from the close on the 11th trading day of February through the close on the 11th trading day of December, every year starting in 1926.
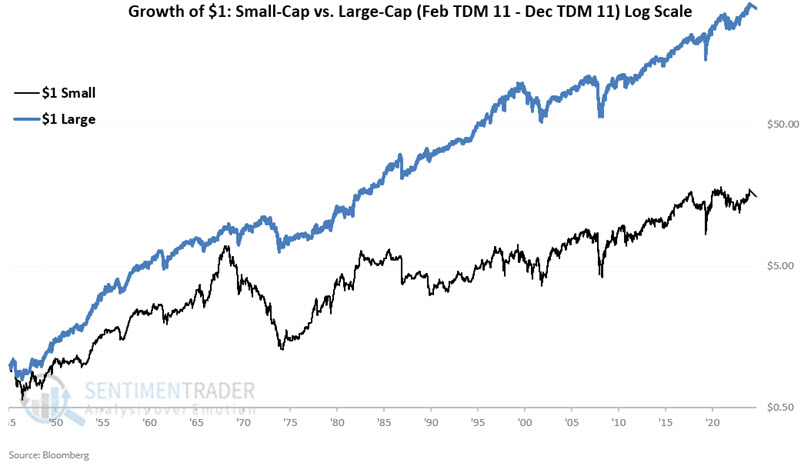
$1 in small caps grew to $17.38 (+1,638%), while $1 in large caps increased to $358.86 (+35,786%). The chart below divides the growth of $1 in small caps by the growth of $1 in large caps from mid-February into mid-December.
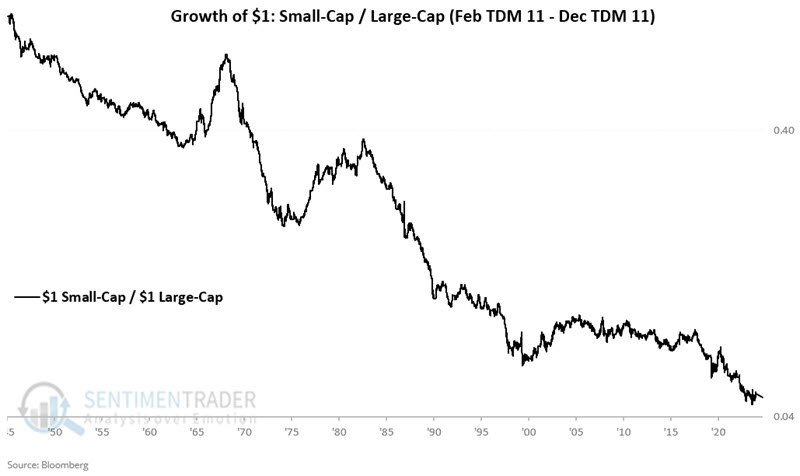
The table below compares small-cap versus large-cap performance from Feb TDM 11 through Dec TDM 11 since 1945.
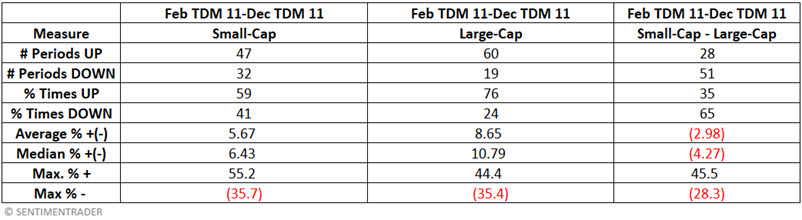
Some key things to note - Large-caps:
- Showed a gain 76% of the time (versus 59% for Small-caps)
- Outperformed Small-caps 65% of the time
- Showed a Median Gain of +10.79% (versus +6.43% for Small-caps)
A Switching Strategy versus doing the opposite
Let's examine a strategy that:
- Holds small-cap stocks during the Dec TDM #11 through Feb TDM #11 period
- Hold large-cap stocks Feb TDM #11 through Dec TDM #11 period
- Starting in December 1945 through November 2024
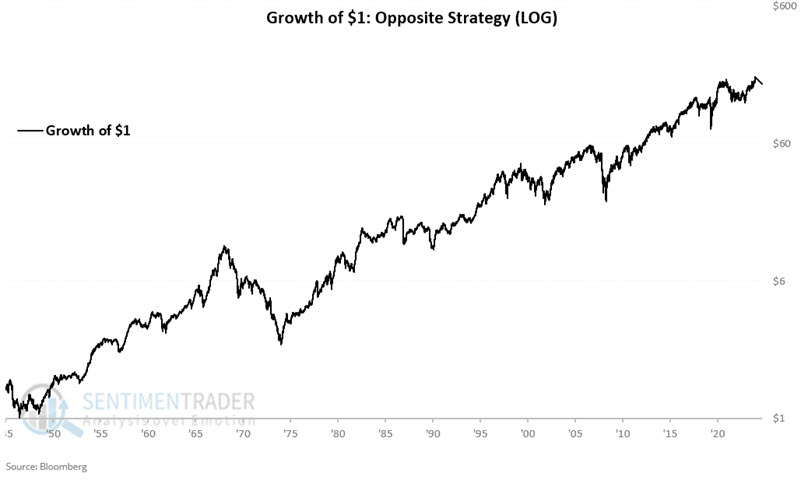
For comparison, we will also consider a strategy that:
- Does just the opposite (i.e., it holds large caps during the December into February period and small caps the rest of the year)
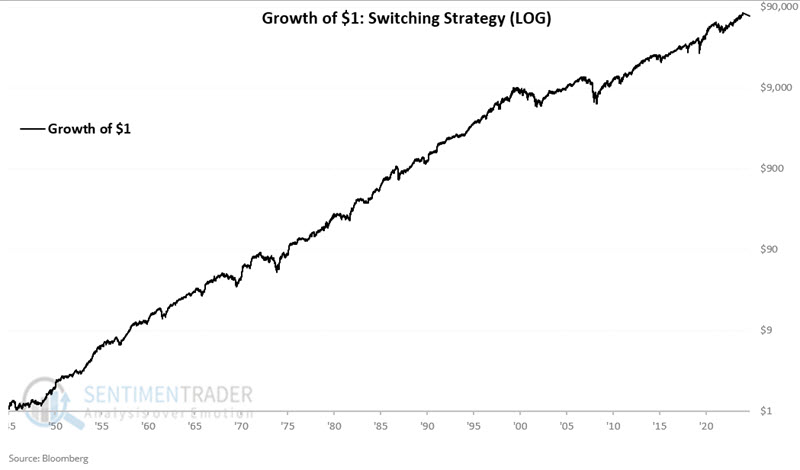
The hypothetical results from 1945 through November 2024 are:
- $1 invested in the Switching Strategy grew to $75,700
- $1 invested in the Opposite Strategy grew to $184
In other words, owning small-caps from mid-December to mid-February and large-caps the rest of the year produced over 400 times the profit of doing the opposite.
The chart below displays the hypothetical growth of $1 using the Switching Strategy.
The chart below displays the hypothetical growth of $1 using the Opposite Strategy.
The chart below plots both of the above equity curves together.
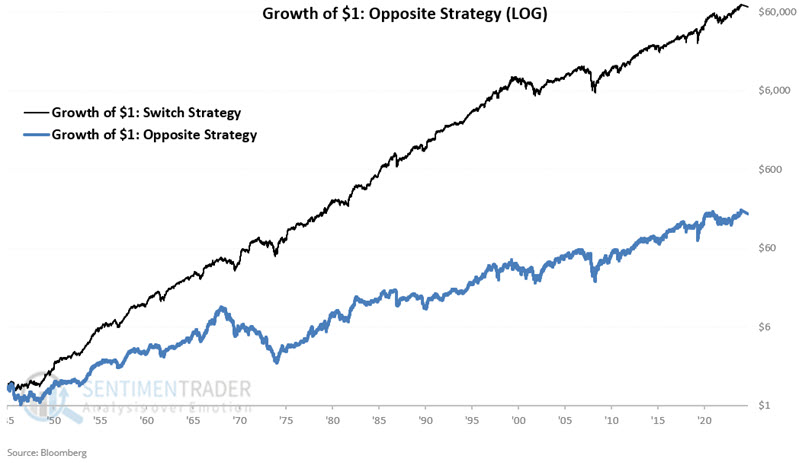
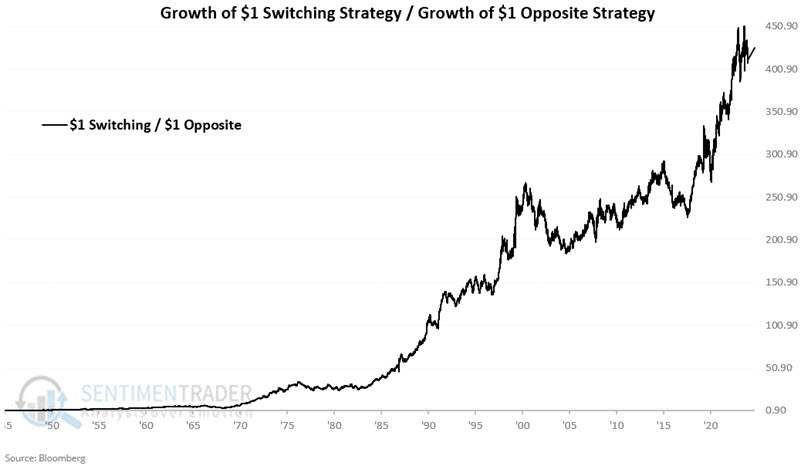
The chart below displays the growth of $1 invested using the Switching Strategy divided by $1 invested using the opposite strategy. While outperformance following the Switching Strategy is no sure thing, thumbing your nose at the tendency for small caps and large caps to perform better during different times of the year would historically have been foolish.
The table below displays the performance of the Switching Strategy versus the Opposite Strategy, measuring one year's results at the close on the 11th trading day of December each year.
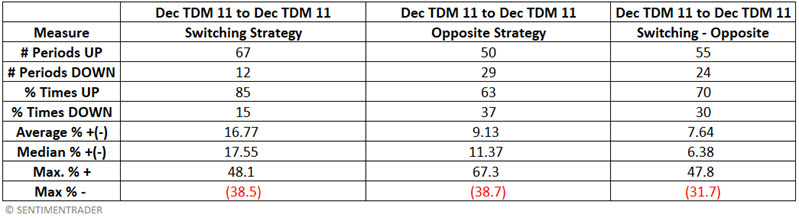
Some key things to note - The Switching Strategy:
- Showed a gain 85% of the time (versus 63% for the Opposite Strategy)
- Outperformed the Opposite Strategy 70% of the time
- Showed a Median Gain of +17.55% (versus 11.37% for the Opposite Strategy
What the research tells us…
The bad news first: There is no guarantee that the tendency for small caps to outperform mid-Dec to mid-Feb and for large caps to outperform the rest of the year will play out that way year-to-year. This can be highly frustrating. Likewise, there is no guarantee that the seasonal trends highlighted herein will continue ad infinitum into the future. With those caveats in mind, for the past century, there has been a clear edge associated with favoring one over the other based on the date shown on the calendar.
Each investor must decide how and to what extent to use knowledge of this edge. A mechanical approach that switches from 100% large-cap to 100% small-cap and back again based on the calendar probably only makes sense if only some portion of investment capital is allocated.