
Small-cap stocks trigger an optimism index buy signal

Key points:
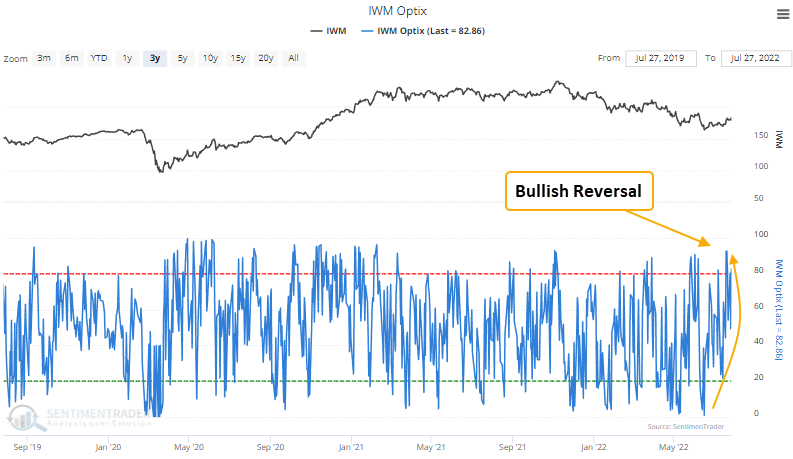
- The Optimism Index for the Russell 2000 ETF (IWM) reversed higher relative to its recent range
- A trading model that uses the Optix Index triggered a new buy signal
- The IWM ETF has rallied 74% of the time after other signals
Using the optimism index to identify bullish sentiment reversals
A trading model that uses the Optimism Index (Optix) to pinpoint when sentiment reverses from a period of pessimism issued a buy signal for the Russell 2000 ETF (IWM) on 7/27/22.
A trading model that identifies a reversal in the optimism index
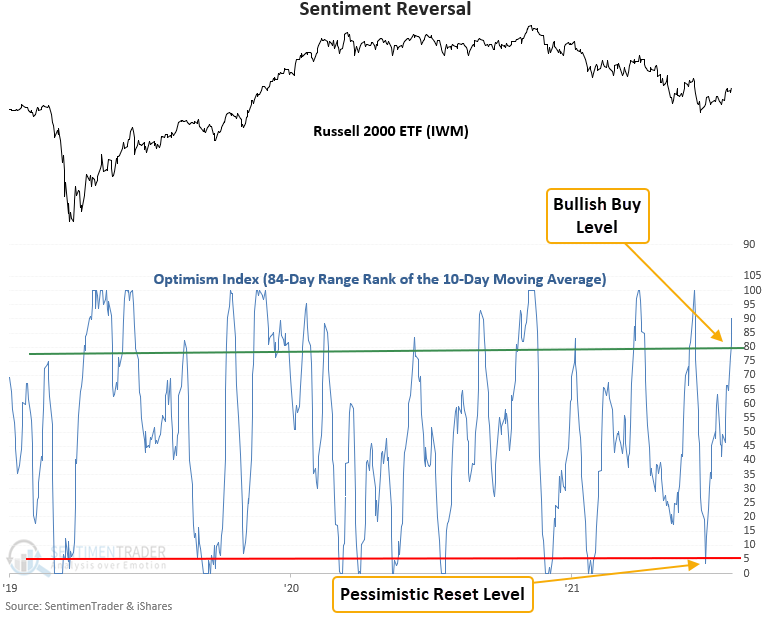
The model applies an 84-day range rank to the 10-day moving average of the Optimism Index for the IWM ETF. The range rank indicator measures the current value relative to all other values over a lookback period. 100 is the highest, and 0 is the lowest. The pessimistic reset condition occurs when the range rank for the Optix Index crosses below the 5th percentile. A new buy signal triggers when the range rank exceeds the 79th percentile, and ETF momentum turns positive within 5 days of the cross.
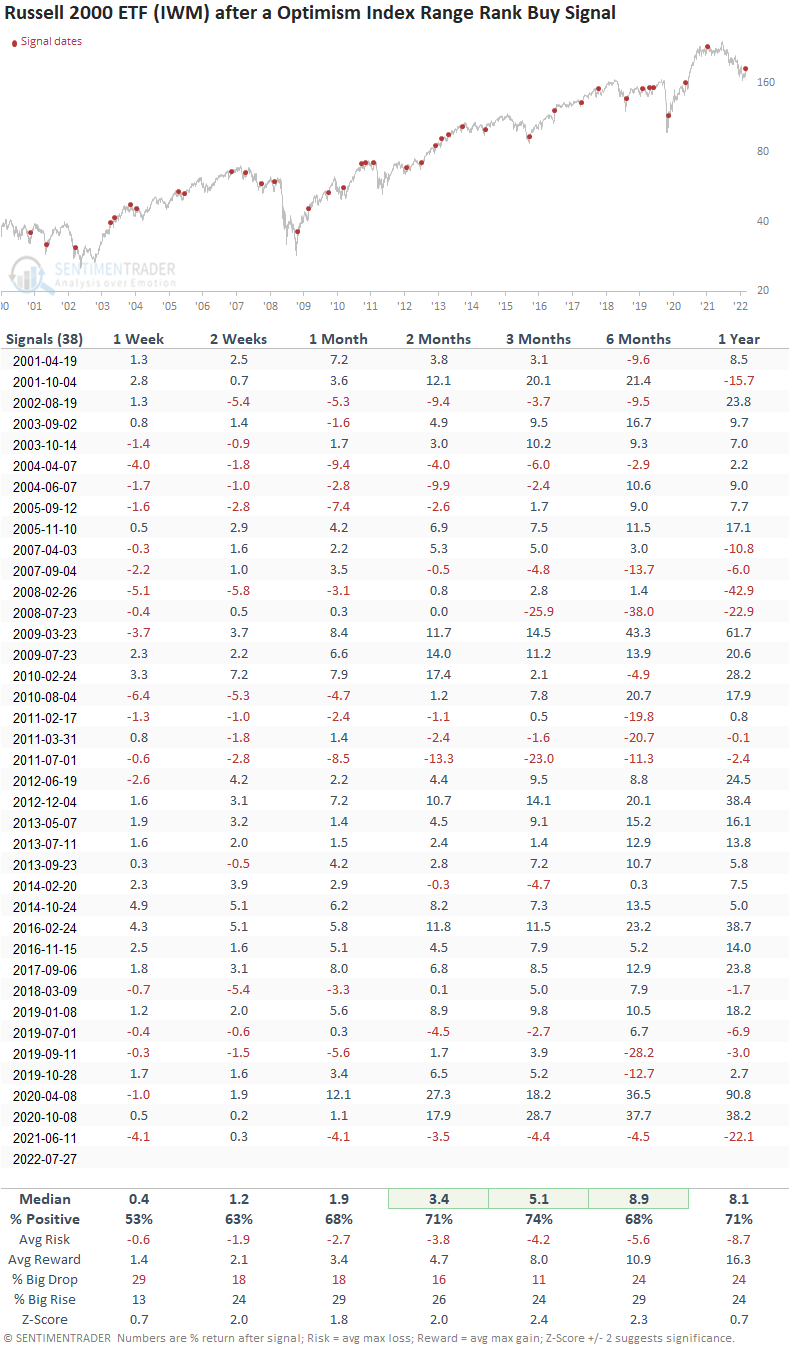
The Russell 2000 ETF rallied 74% of the time after other signals
This model generated a signal 38 other times over the past 20 years. After the others, the Russell ETF future returns, win rates, and z-scores were solid across all time frames, especially the 2-month window. During the challenging 2000-02 and 2007-8 bear markets, the signal had a win rate of 80% when looking forward by 2 months. So, even if the current rally is a bear market bounce, one could potentially benefit from a properly managed trade.
Small-cap outperformance during bear markets
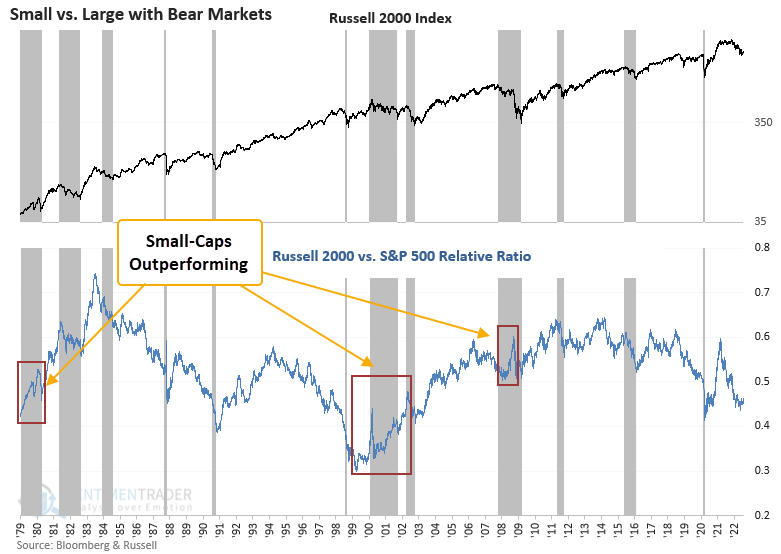
The relative ratio for the Russell 2000 versus the S&P 500 bottomed over 2 months ago on 5/11/22. While small-caps generally underperform large-caps during bear market cycles, it's not unprecedented to see periods of outperformance. The 2000-02 period is a fascinating analog as you had a strong dollar and severe underperformance from the technology sector, similar to today.
Small-cap leadership trends
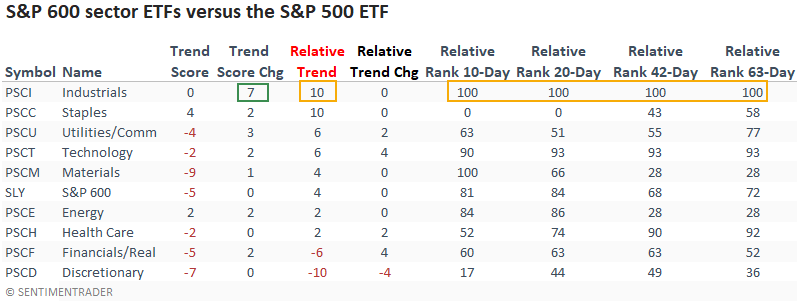
Interestingly, the small-cap industrial sector looks the best versus the S&P 500, with a relative rank of 100% across the trailing 10, 20, 42, and 63 days. The relative rank indicator measures the current ratio relative to all other ratio values over a lookback period. 100 is the highest, and 0 is the lowest. I would also note the recent 7-point increase in the absolute price trend score. Trend scores rank from 10 (best) to -10 (worst).
What the research tells us...
When the optimism index for the Russell 2000 ETF (IWM) reverses from a pessimistic level, it signals that traders have become more optimistic about the future direction of small-cap stocks. Using the Optix index to measure that change in sentiment, similar setups to what we're seeing now have preceded rising prices for the Russell 2000 ETF. History suggests small-caps can outperform during a bear market cycle, especially when a large-cap sector with a significant index weighting like technology is under pressure. From a top-down macro view, one has to wonder what the economically-sensitive small-cap stocks are signaling, given that most economic data is pointing down. Remember, the market will bottom before the economy.