Products
SentimenTrader Trading Tools
‍
Backtest Engine
My Trading Toolkit
Correlation Analysis
Seasonality
Market Prediction
Indicators & Data API
‍
Proprietary Indicators & Charts
Market Data API
Strategies & Scanner
‍
50+ Trading Strategies
Smart Stock Scanner
Smart Option Scanner
Research Reports
‍
Research Solutions
Reports Library
Free Resources
Simple Backtest Calculator
Simple Seasonality Calculator
The Kelly Criterion Calculator
Sentiment Geo Map
Public Research Reports
Education
Sentiment Indicators
Technical Indicators
Pricing
Company
About
In the News
Testimonials
Client Success Stories
Contact
Log inLoginSign up
< BACK TO ALL REPORTS

Small-cap stocks trigger a risk-on buy signal

Dean Christians
2022-08-08
A trading model based on the ratio between small and large stocks triggered a risk-on buy signal. The newfound resurgence in small-cap stock performance bodes well for the overall market, with solid win rates across all time frames.

Key points:

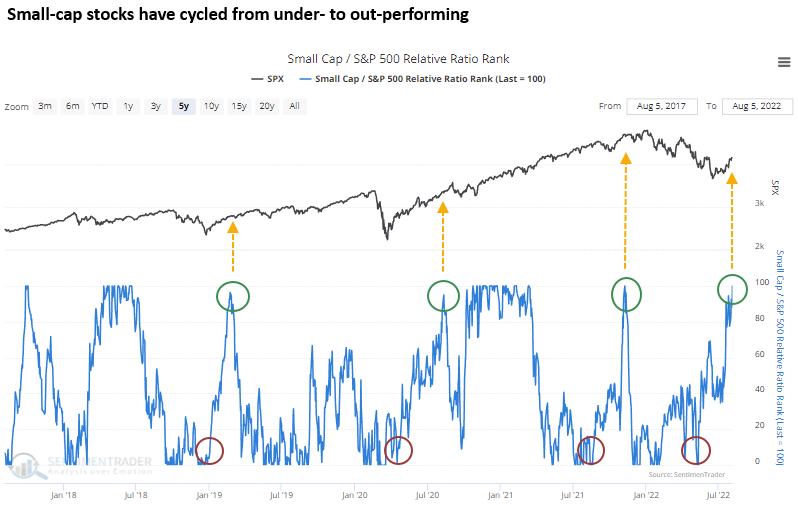
  • The ratio between small and large stocks surged to the highest level relative to its recent range
  • A trading model that monitors this relationship triggered a new buy signal last week
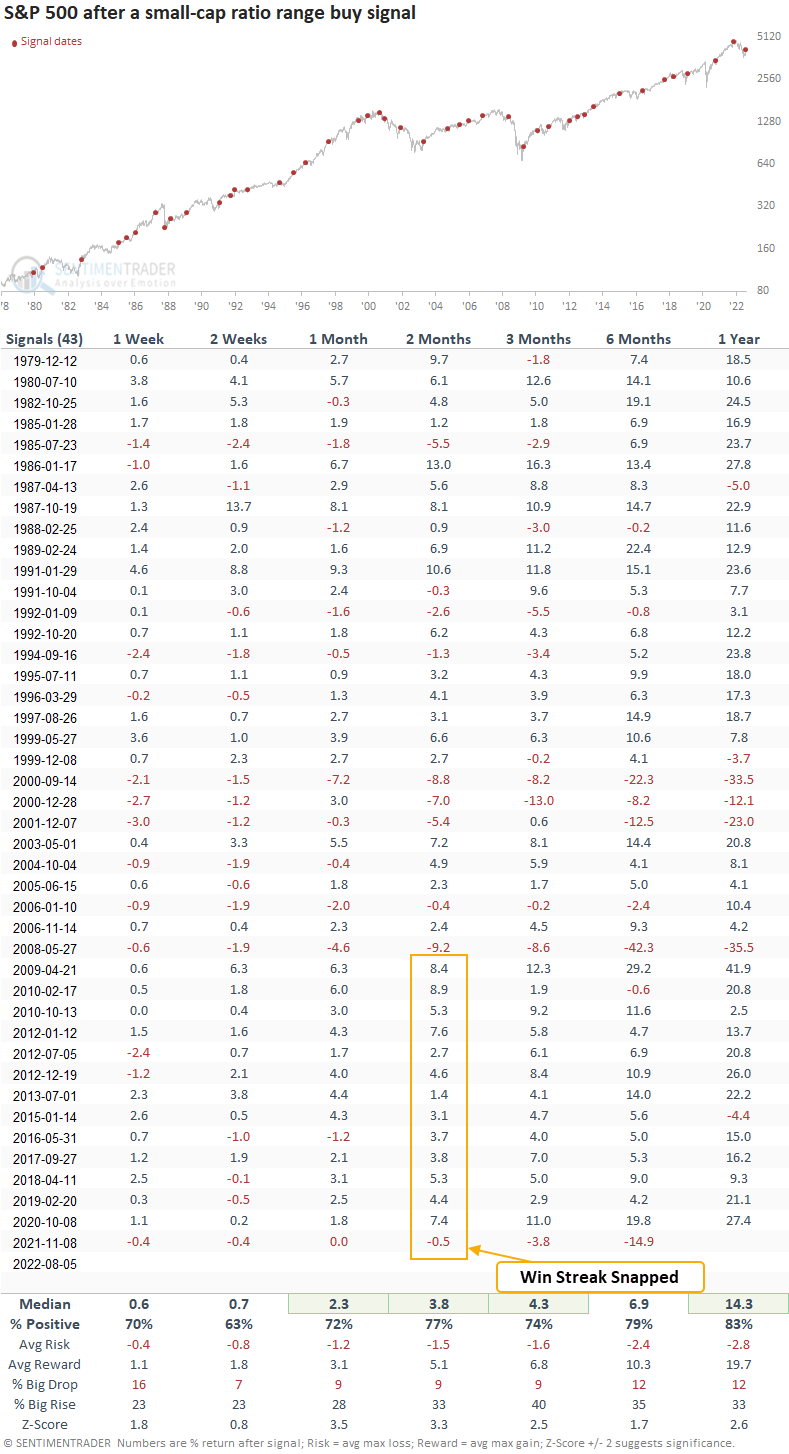
  • Large-cap stocks rallied 77% of the time over the next two months after other signals
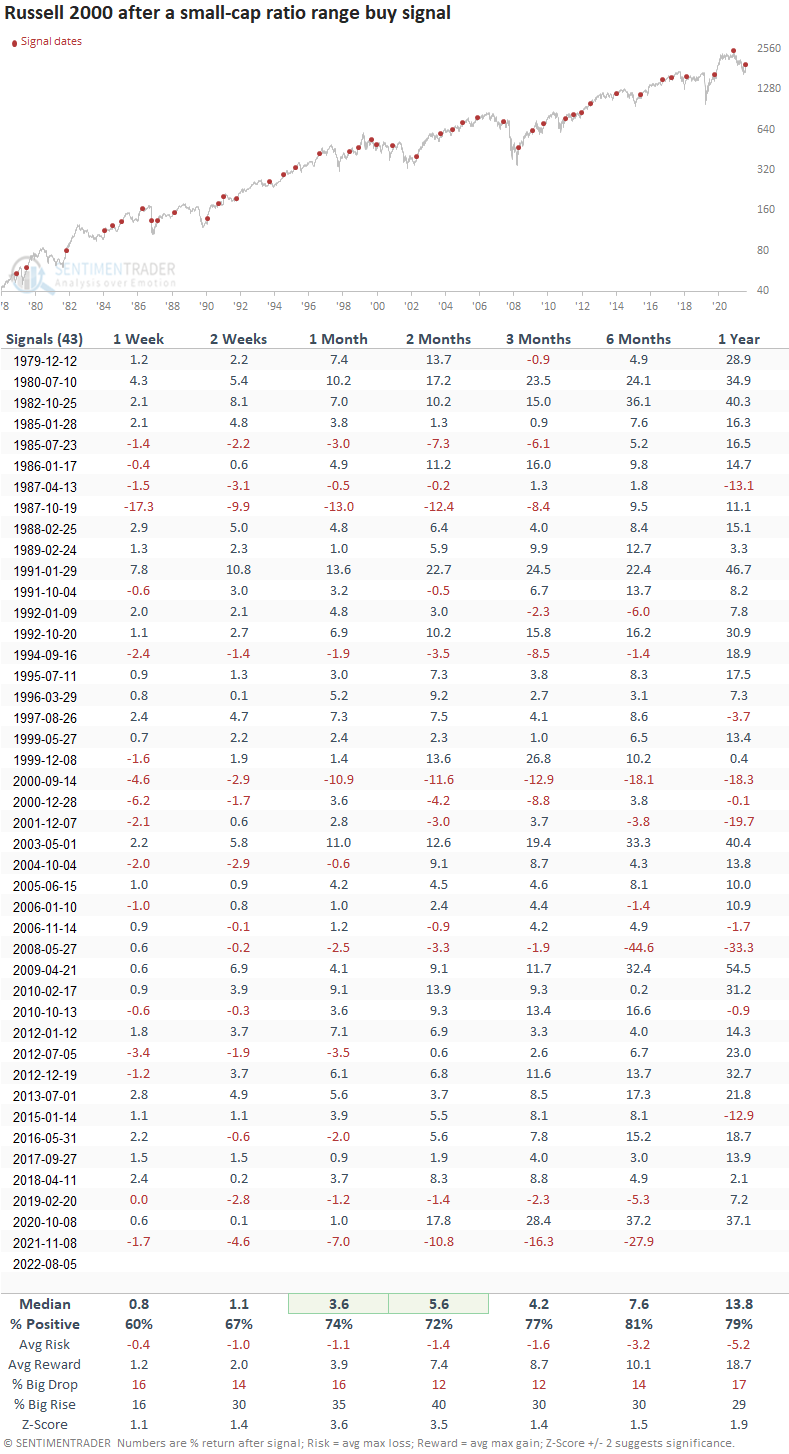
  • Small-cap stocks rallied 74% of the time over the next month after other signals

Economically-sensitive small-cap stocks as a broad market risk-on barometer 

Since the 6/16/22 low, the Russell 2000 is up 16%, while the S&P 500 has managed to gain 13%. The outperformance by small-cap stocks is a welcome development. Historically, small-cap stocks have performed better than large-cap stocks in the initial stages of a new cyclical uptrend.

A trading model that measures when small-cap stocks reverse from underperforming to outperforming relative to large-cap stocks issued a buy signal at the close of trading last Friday. The model is a component of the TCTM Composite Confirmation Model.

The Small Cap/S&P 500 Relative Ratio Rank signal triggers when the 4-month range rank for the ratio between small and large stocks reverses from less than 1% to greater than 97%. 

Small-cap stocks trigger a risk-on buy signal

The S&P 500 rallied 77% of the time over the next two months after other signals

This model triggered a signal 43 other times over the past 43 years. After the others, large-cap stocks performed well across all time frames, with several meaningful risk/reward profiles and z-scores. While the signal avoided a whipsaw alert in the 1980-82 bear market, it struggled during other significant drawdown periods, especially in 2000-02.

Small-cap stocks trigger a risk-on buy signal

The Russell 2000 rallied 74% of the time over the next month after other signals

Small-cap stocks also enjoyed robust results, with solid risk/reward profiles and z-scores across all time frames. And, the bear market signals look significantly better compared to S&P 500 results.

Small-cap stocks trigger a risk-on buy signal

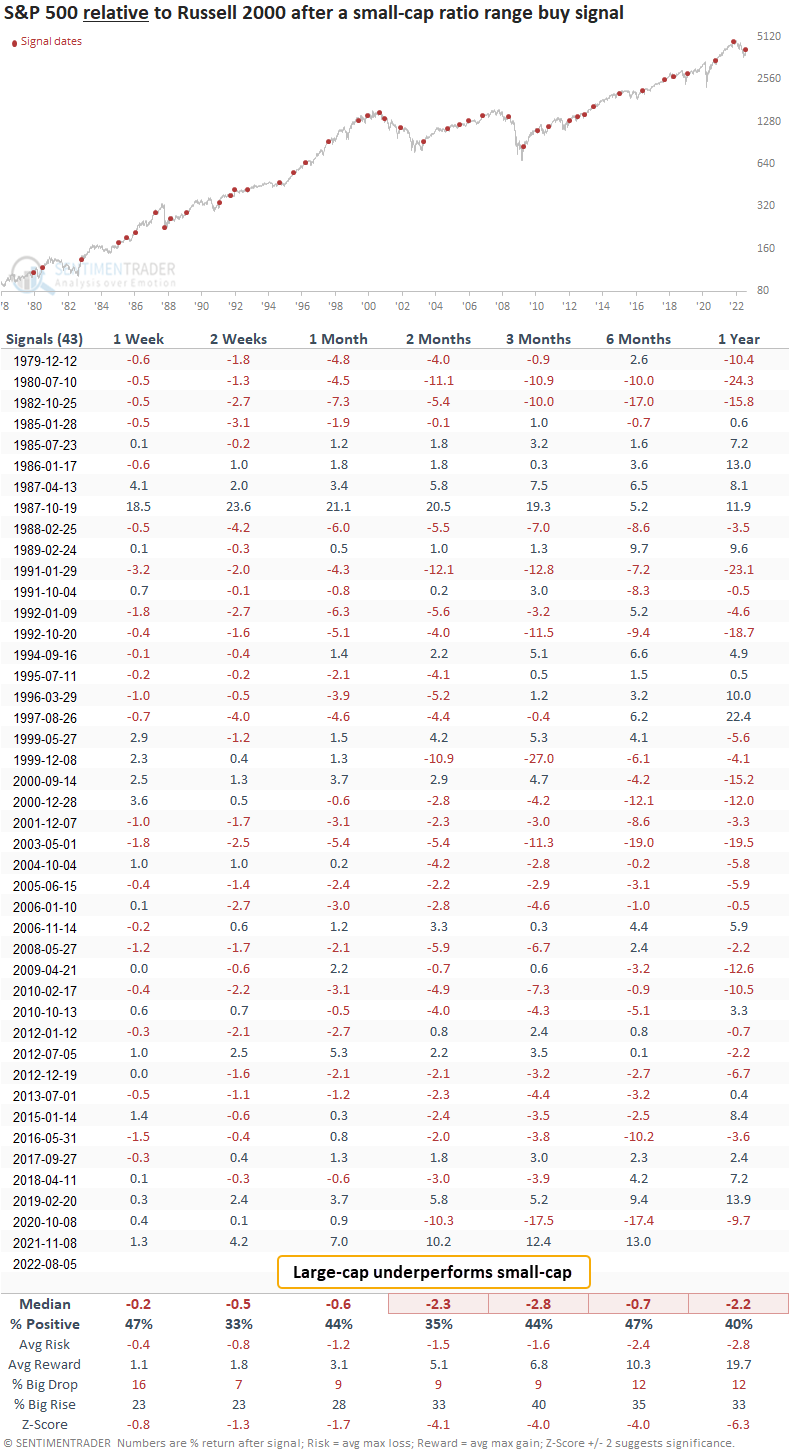
Small-cap stocks tend to outperform large-cap stocks

Looking at the net difference between S&P 500 and Russell 2000 returns, the outlook table suggests a more favorable environment for small-cap stocks. 

Small-cap stocks trigger a risk-on buy signal

What the research tells us...

When small-cap stocks reverse from underperforming to outperforming large-cap stocks, the resurgence in more economically-sensitive stocks provides a tailwind for the overall market. Similar setups to what we're seeing now have preceded rising prices for the S&P 500 and the Russell 2000, with solid risk/reward profiles and z-scores across all time frames. An allocation to small stocks looks more favorable in bull and bear market environments.

PRODUCTS
SentimenTrader
Trading Tools
Indicators & Data API
‍
Strategies & Scanner
‍
Research Reports
FREE
RESOUrCES
Simple Backtest
Calculator
Simple Seasonality
Calculator
The Kelly Criterion
Calculator
Sentiment Geo Map
‍
Public Research Reports
‍
Education
Sentiment Indicators
‍
Technical Indicators
‍
Pricing
Bundle pricing
‍
FAQ
‍
Announcements
‍
COMPANY
‍
About
‍
In the News
‍
Testimonials
‍
Client Success Stories
CONTACT
‍
General Inquiries
‍
Media Inquiries
‍
Financial Professionals Inquiries
‍
© 2026 Sundial Capital Research Inc. All rights reserved.
Setsail Marketing
TermsPrivacyAffiliate Program
Risk Disclosure: The information and tools provided are for research and analytical purposes only and are not intended as investment advice. Market analysis involves uncertainty, and outcomes may differ from expectations. Users should conduct their own due diligence and consider their individual circumstances before making any financial decisions. Past performance is not necessarily indicative of future results.

Hypothetical Performance Disclosure: Hypothetical performance results have many inherent limitations, some of which are described below. No representation is being made that any account will or is likely to achieve profits or losses similar to those shown; in fact, there are frequently sharp differences between hypothetical performance results and the actual results subsequently achieved by any particular trading program. One of the limitations of hypothetical performance results is that they are generally prepared with the benefit of hindsight. In addition, hypothetical trading does not involve financial risk, and no hypothetical trading record can completely account for the impact of financial risk of actual trading. for example, the ability to withstand losses or to adhere to a particular trading program in spite of trading losses are material points which can also adversely affect actual trading results. There are numerous other factors related to the markets in general or to the implementation of any specific trading program which cannot be fully accounted for in the preparation of hypothetical performance results and all which can adversely affect trading results.

Testimonial Disclosure: Testimonials appearing on this website may not be representative of other clients or customers and is not a guarantee of future performance or success.