Products
SentimenTrader Trading Tools
‍
Backtest Engine
My Trading Toolkit
Correlation Analysis
Seasonality
Indicators & Data API
‍
Proprietary Indicators & Charts
Market Data API
Strategies & Scanner
‍
50+ Trading Strategies
Smart Stock Scanner
Research Reports
‍
Research Solutions
Reports Library
Free Resources
Simple Backtest Calculator
Simple Seasonality Calculator
The Kelly Criterion Calculator
Sentiment Geo Map
Public Research Reports
Education
Sentiment Indicators
Technical Indicators
Pricing
Company
About
In the News
Testimonials
Client Success Stories
Contact
Log inLoginSign up
< BACK TO ALL REPORTS

Small-Cap Stocks Haven't Run Like This Since 1995

Jason Goepfert
2021-06-02
May brought most investors another gain on their statements, adding to an impressive run, with small-cap stocks notched 8 straight positive months.

With a flood of money combining with preternaturally calm conditions in the broader market, equity investors can't help themselves. Once again, buying interest was enough to push the S&P 500 to a record monthly close in May.

For the most widely-benchmarked index in the world, this was its 4th consecutive month with an all-time high. After the 18 other times it managed a feat like this since 1928, risk outweighed reward over the next six months only twice.

While they've settled back recently, part of the momentum has been due to a tremendous run in Small-Cap stocks, which just ended their 8th straight month with a positive total return, tied for the 5th-longest streak since 1926. 

Small cap stock consecutive months with gain

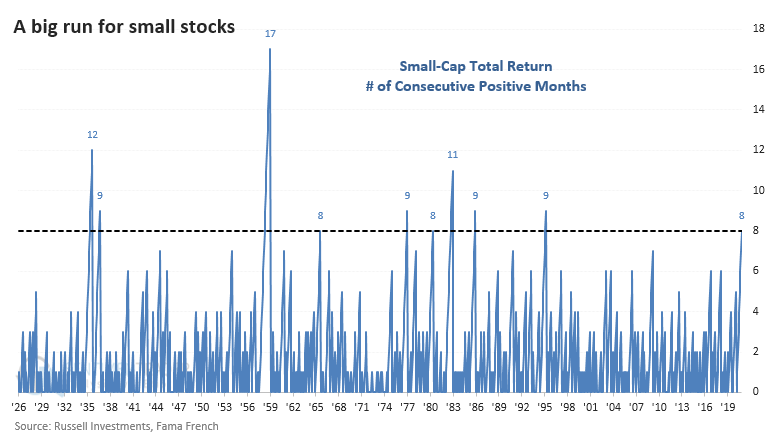
After other 8-month winning streaks, Small-Caps have tended to keep going, but there were some rough patches. A few times, they lost more than 10% over the next six months, though there was only one (very) large loss a year later. 

Looking at the other end of the spectrum, the Dow Jones Industrial Average just celebrated its 125th anniversary by recording its 6th-largest gain over a 14-month stretch.

We've seen time and time again since last April that momentum does not die easily.  

Stat Box

Over the past 3 months, individual investors in the AAII sentiment survey have allocated an average of more than 70% of their portfolios to stocks. According to our Backtest Engine, there have been 36 months since 1987 when the average has been this high. Over the next 3 years, the S&P 500 averaged a return of -5.5%.


What else we're looking at

  • Full returns in the S&P 500 after streaks with record monthly closes
  • What happens in small-cap stocks after rallying for 8 straight months
  • Since 1896, a look at the Dow's future returns following jumps of 50%
  • Why the dollar is about to enter an unfavorable period
  • An update on industry, sector, and country absolute and relative trends
PRODUCTS
SentimenTrader
Trading Tools
Indicators & Data API
‍
Strategies & Scanner
‍
Research Reports
FREE
RESOUrCES
Simple Backtest
Calculator
Simple Seasonality
Calculator
The Kelly Criterion
Calculator
Sentiment Geo Map
‍
Public Research Reports
‍
Education
Sentiment Indicators
‍
Technical Indicators
‍
Pricing
Bundle pricing
‍
FAQ
‍
Announcements
‍
COMPANY
‍
About
‍
In the News
‍
Testimonials
‍
Client Success Stories
CONTACT
‍
General Inquiries
‍
Media Inquiries
‍
Financial Professionals Inquiries
‍
© 2026 Sundial Capital Research Inc. All rights reserved.
Setsail Marketing
TermsPrivacyAffiliate Program
Risk Disclosure: Futures and forex trading contains substantial risk and is not for every investor. An investor could potentially lose all or more than the initial investment. Risk capital is money that can be lost without jeopardizing ones’ financial security or life style. Only risk capital should be used for trading and only those with sufficient risk capital should consider trading. Past performance is not necessarily indicative of future results.

Hypothetical Performance Disclosure: Hypothetical performance results have many inherent limitations, some of which are described below. No representation is being made that any account will or is likely to achieve profits or losses similar to those shown; in fact, there are frequently sharp differences between hypothetical performance results and the actual results subsequently achieved by any particular trading program. One of the limitations of hypothetical performance results is that they are generally prepared with the benefit of hindsight. In addition, hypothetical trading does not involve financial risk, and no hypothetical trading record can completely account for the impact of financial risk of actual trading. for example, the ability to withstand losses or to adhere to a particular trading program in spite of trading losses are material points which can also adversely affect actual trading results. There are numerous other factors related to the markets in general or to the implementation of any specific trading program which cannot be fully accounted for in the preparation of hypothetical performance results and all which can adversely affect trading results.

Testimonial Disclosure: Testimonials appearing on this website may not be representative of other clients or customers and is not a guarantee of future performance or success.