
Six seasonally scary sectors

Key points
- Seasonality can be helpful in deciding when and where to allocate capital
- Sometimes, it can make sense to avoid a sector during a period of typical seasonal weakness
- Six sectors have imminent seasonal windows that are especially weak
Sector summer weakness
Our ultimate goal in the markets is to make (or save) money. For aggressive traders, sometimes that can mean playing the short side of a given security or sector. However, for most investors, one of the best plays is to lighten up on or avoid altogether a sector that is expected to show weakness.
When evaluating a sector, I look for opportunities where price action and seasonality align. A long position is preferred if price action is favorable during a typically favorable seasonal period (and vice versa for a short position). However, I also look for opportunities to lighten up or sell a sector that is entering seasonal weakness, particularly if I can sell into strength.
Most of the sectors discussed below fall into this latter category. They have been in a strong uptrend, but are entering a period of significant seasonal weakness.
Sector #1: Gold stocks
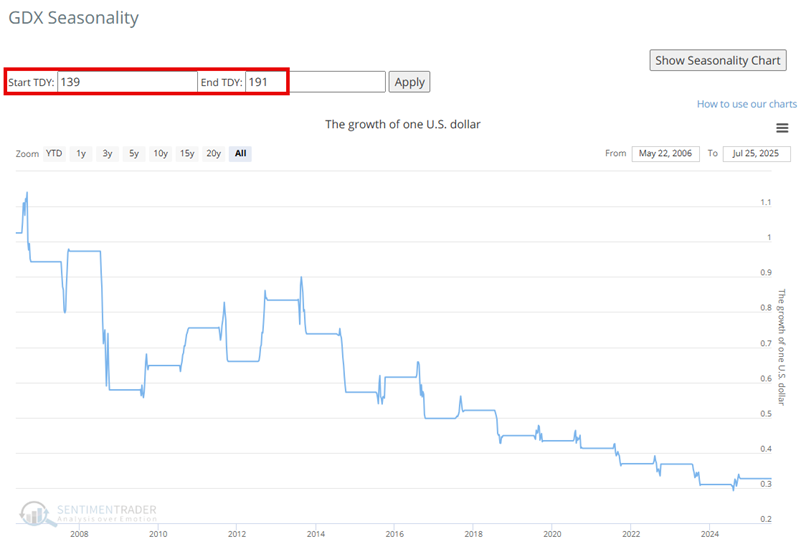
The Annual Seasonal Trend chart for the VanEck Gold Miners ETF (GDX) has entered an unfavorable period that extends from Trading Day of the Year (TDY) #139 through TDY #191. For 2025, this period extends from July 24th through October 7th.
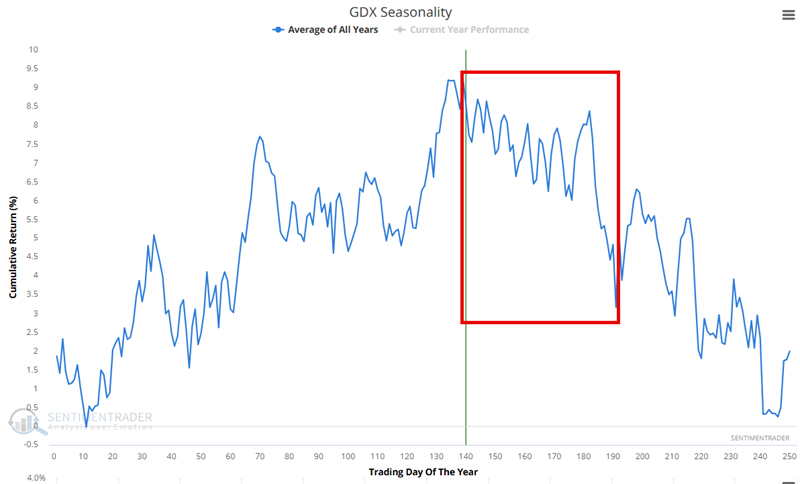
A hypothetical $1 invested in GDX during this period, every year since 2006, has declined 67% to $0.33.
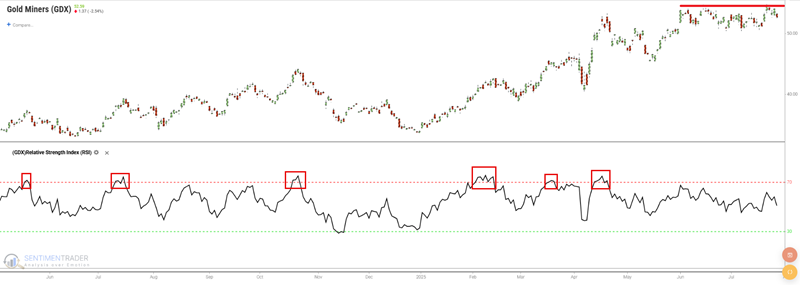
GDX has rallied over 60% since late December 2024. However, a recent 14-day RSI reading above 70 has been followed by a choppy - but so far, failed - attempt to breakout to the upside.
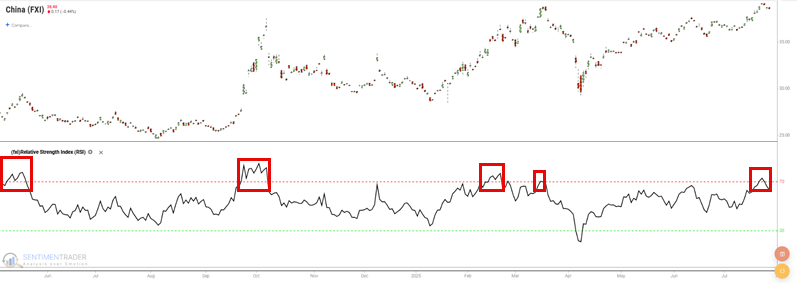
Sector #2: Chinese stocks
The Annual Seasonal Trend chart for the iShares China Large-Cap ETF (FXI) has entered an unfavorable period that extends from Trading Day of the Year (TDY) #140 through TDY #160. For 2025, this period extends from July 25th through August 22nd.
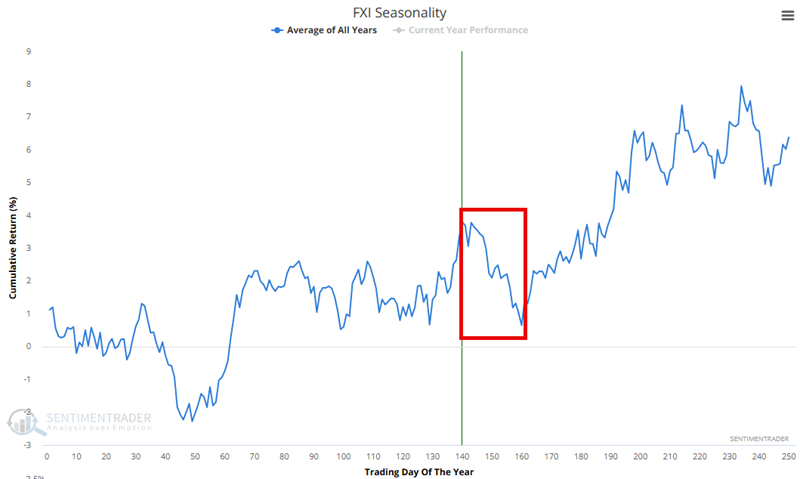
A hypothetical $1 invested in FXI during this period, every year since 2006, has declined 79% to $0.21.
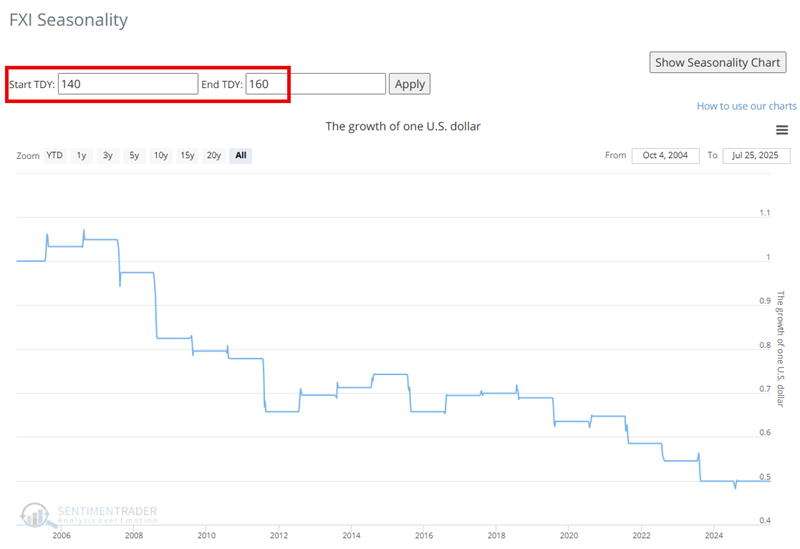
Currently, FXI's price action does not agree with the unfavorable seasonal trend. However, the 14-day RSI recently popped about 70, a level that has often suggested the end of a rally.
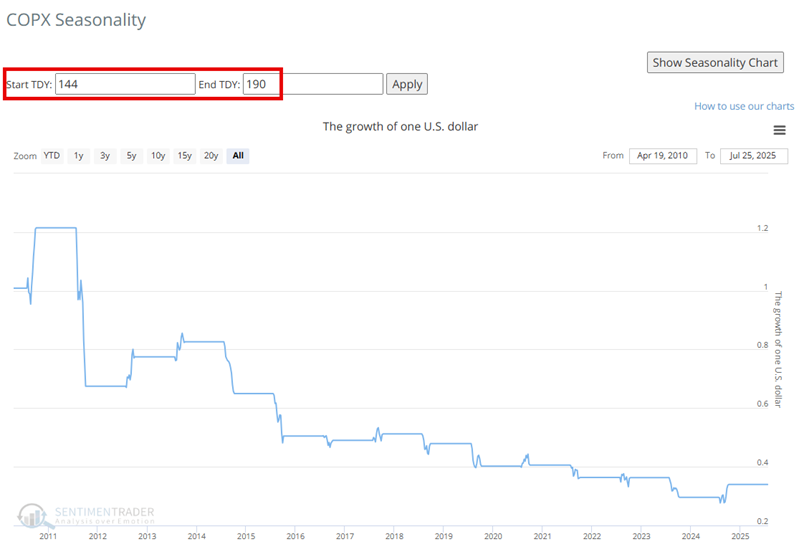
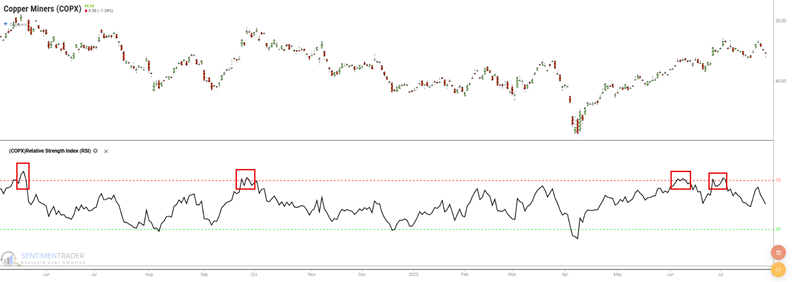
Sector #3: Copper mining stocks
The Annual Seasonal Trend chart for the Global X Copper Miners ETF (COPX) will soon enter an unfavorable period that extends from Trading Day of the Year (TDY) #144 through TDY #190. For 2025, this period extends from July 31st through October 6th.
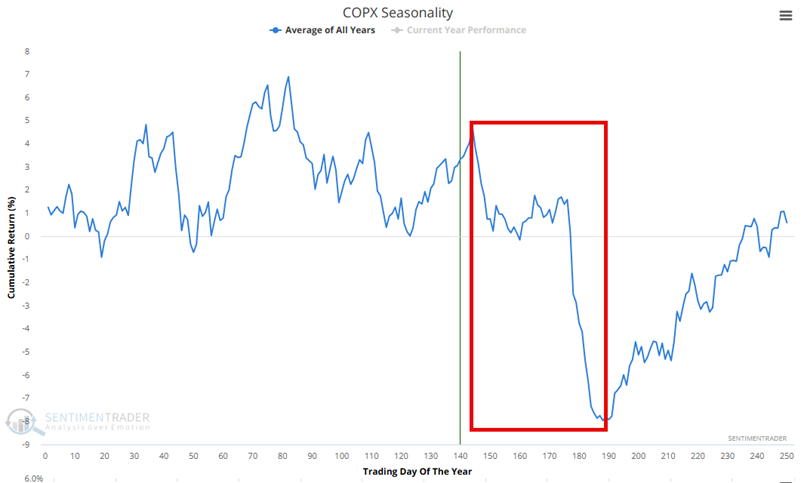
A hypothetical $1 invested in COPX during this period, every year since 2006, has declined 79% to $0.21.
Currently, COPX price action does not agree with the unfavorable seasonal trend. However, the 14-day RSI recently popped about 70, a level that has typically marked the end of a rally.
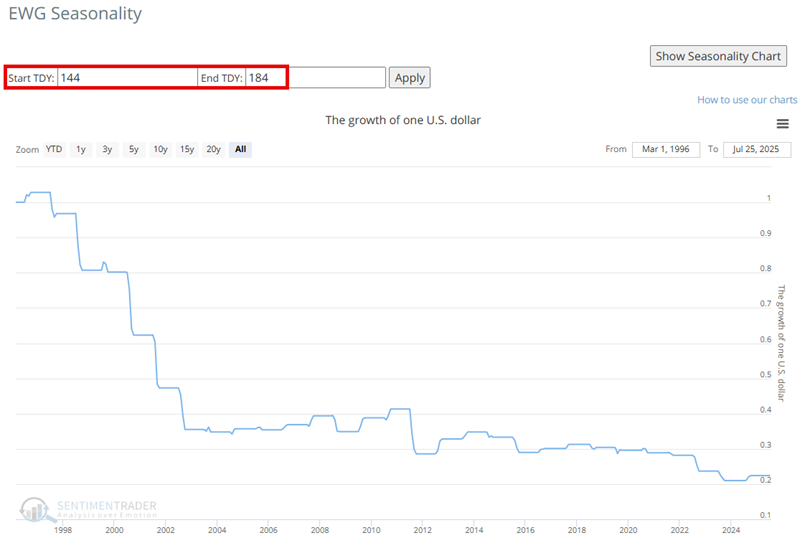
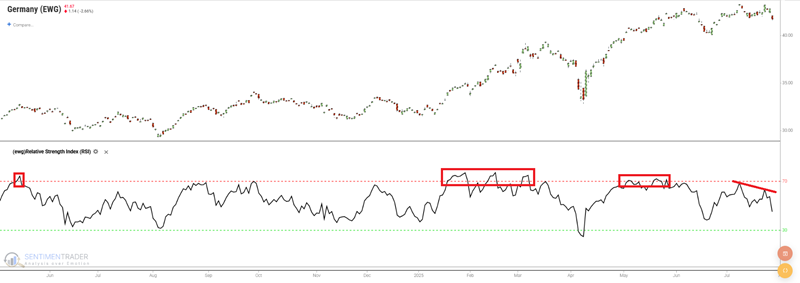
Sector #4: German stock market
The Annual Seasonal Trend chart for the iShares MSCI Germany ETF (EWG) will soon enter an unfavorable period that extends from Trading Day of the Year (TDY) #144 through TDY #184. For 2025, this period extends from July 31st through September 26th.
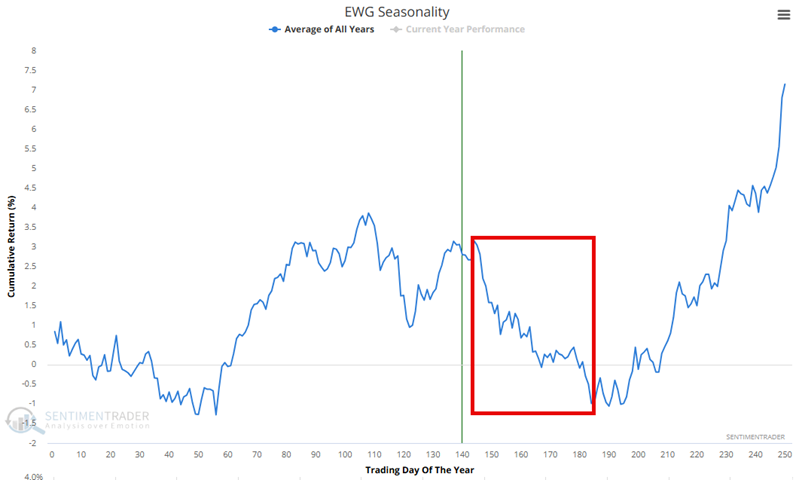
A hypothetical $1 invested in EWG during this period, every year since 1996, declined 78% to $0.22.
EWG enjoyed a 32% rally off the April 2025 low. However, upside momentum has recently stalled.
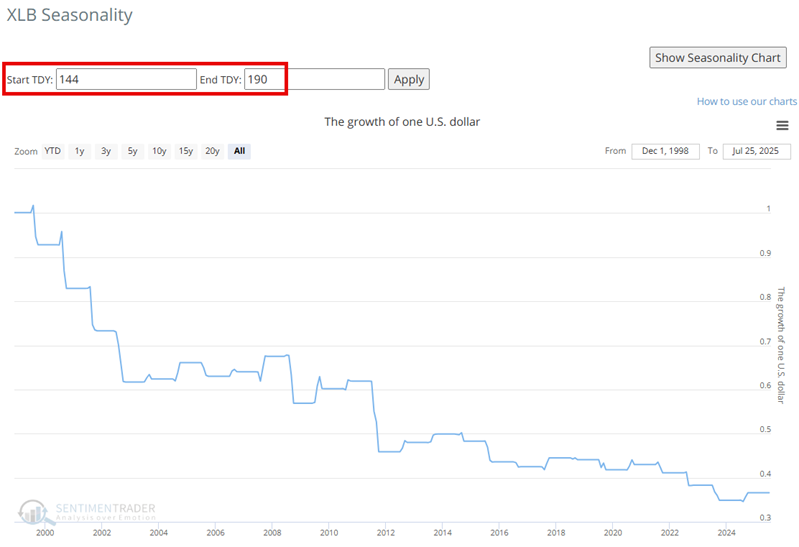
Sector #5: The Materials sector
The Annual Seasonal Trend chart for the Materials Select Sector SPDR Fund (XLB) will soon enter an unfavorable period that extends from Trading Day of the Year (TDY) #144 through TDY #190. For 2025, this period extends from July 31st through October 7th.
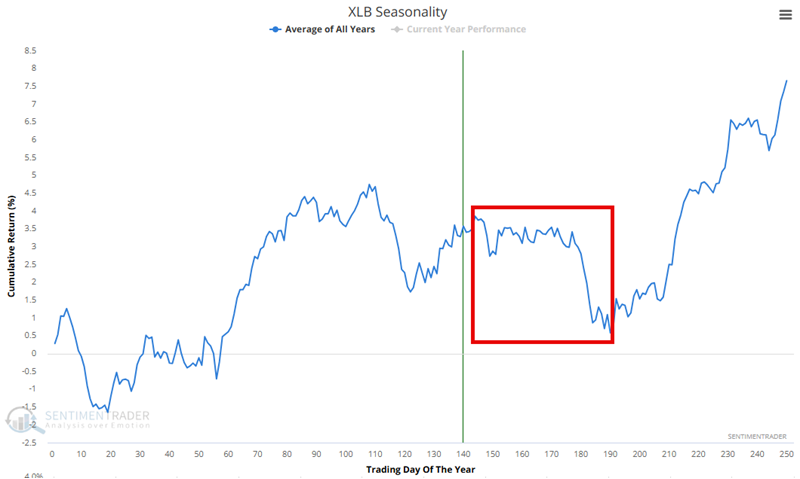
A hypothetical $1 invested in XLB during this period, every year since 1999, declined 62% to $0.38.
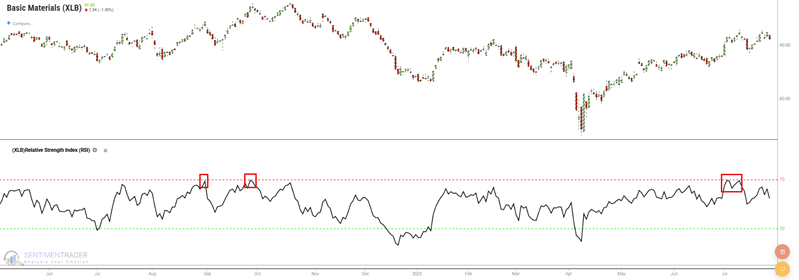
Unlike many S&P 500 sectors - and despite a 27% rally off the April 2025 low - the materials sector has failed to approach its 2024 highs, which is a sign of relative weakness versus the overall market.
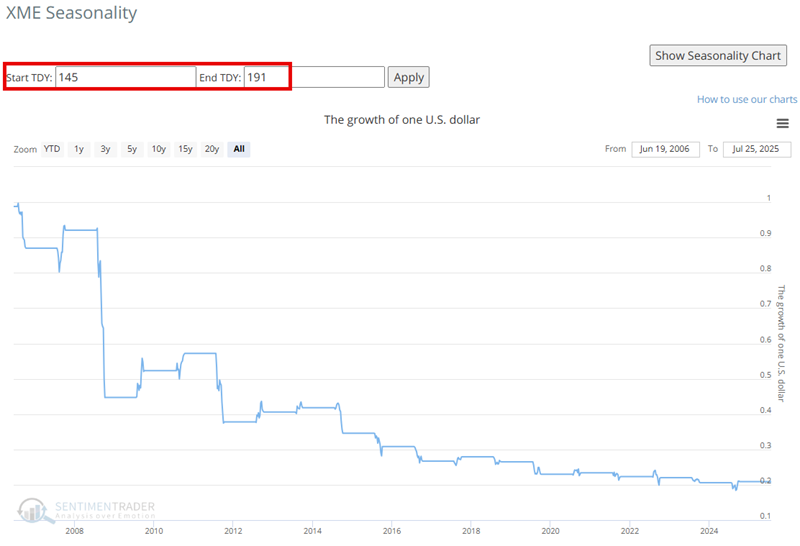
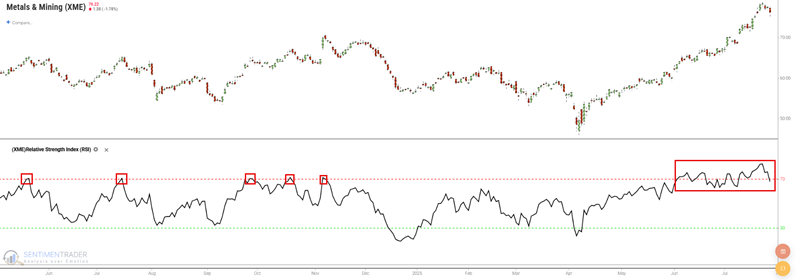
Sector #6: The Metals and Mining Sector
The Annual Seasonal Trend chart for the SPDR S&P Metals & Mining ETF (XME) will soon enter an unfavorable period that extends from Trading Day of the Year (TDY) #145 through TDY #191. For 2025, this period extends from August 4th through October 7th.
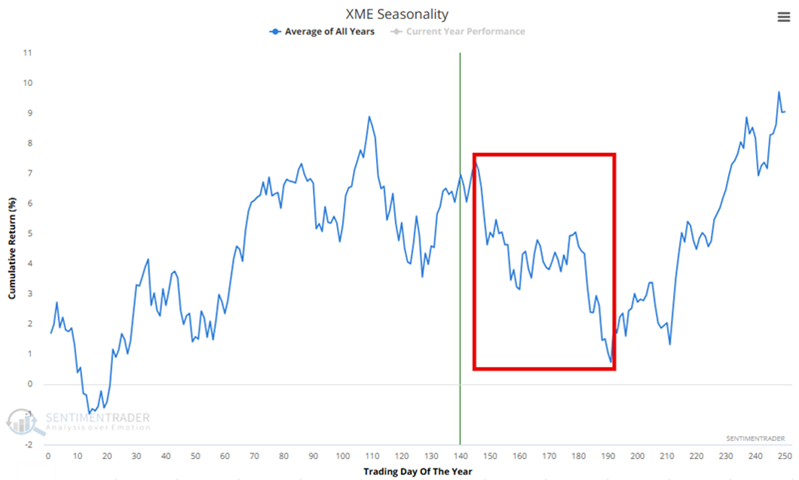
A hypothetical $1 invested in XME during this period, every year since 2006, declined 77% to $0.23.
XME has shown exceptional strength, rocketing over 70% higher since the April 2025 low. In the process, it has shrugged off repeated 70+ readings from the 14-day RSI. Nevertheless, history suggests this may be an opportunity to take profits and stand aside for a while.
What the research tells us…
Each highlighted sector has two things in common: They have shown exceptional strength recently and are now entering a period of typical seasonal weakness. It is dangerous to sell short something that is showing strength unless you are experienced in this type of trading. However, the message here is more about profit-taking and/or allocating elsewhere rather than a call to engage in short-selling. History suggests that investors can find better opportunities elsewhere in the months ahead.