
Simple tweaks to improve the January Barometer

Key Points
- The January Barometer suggests that stock market performance during January tends to foreshadow performance for the rest of the year
- We examine the performance of this approach...
- ...and suggest a simple tweak to improve long-term performance significantly
The January Barometer
The January Barometer was developed by the legendary Yale Hirsch, founder of The Stock Traders Almanac. The theory was simple: As January goes, so goes the rest of the year. In reality, a more accurate theory might state: If January is up, buy and hold stocks for the rest of the year; if January is down, consult another indicator to tell you what to do the rest of the year.
For testing, we look at price performance for the S&P 500 Index from 1939-12-31 through 2024-01-25.
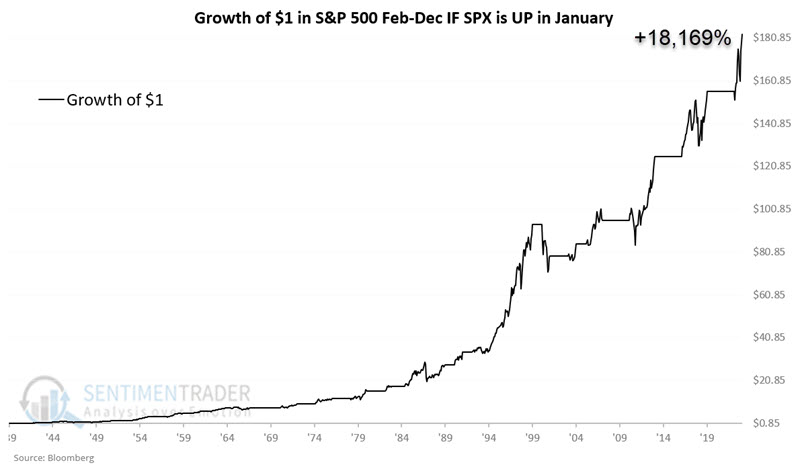
The chart below displays the growth of $1 invested in the S&P 500 Index from the end of January through the end of December of the same year if the S&P 500 showed a gain during the month of January. The cumulative gain is +18,169%.
On the other hand, the chart below displays the growth of $1 invested in the S&P 500 Index from the end of January through the end of December of the same year if the S&P 500 showed a loss during the month of January. The cumulative gain is +115%.
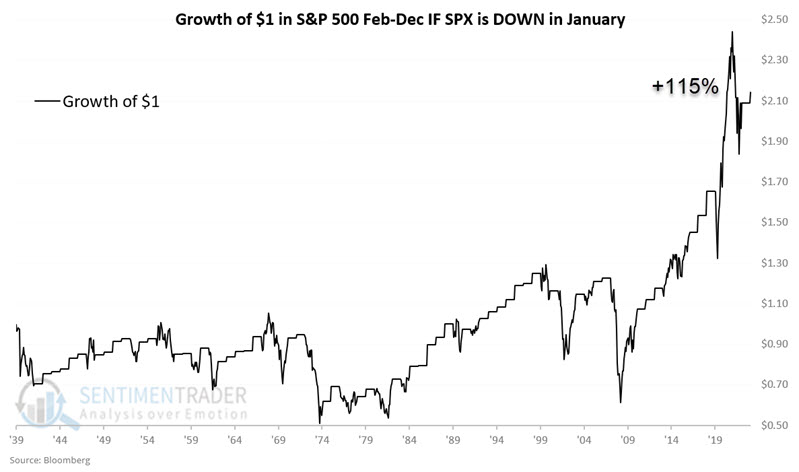
There is a vast difference in the general trend of returns and the absolute returns themselves (+18,169% vs. +115%). Still, the problem is obvious: If an investor were to rely upon this indicator to be 100% in or out of stocks, they would have underperformed a simple buy-and-hold approach.
Bottom line: There are much better and more consistently positive results (with notable exceptions like 1987 and 2001) if January is up, but not necessarily "bearish" results if January is down. Still, as a factor in a "weight of the evidence" approach, an "up" January falls on the favorable side of the ledger.
A closer look at adding "next January"
Let's examine the results of the two following "strategies:"
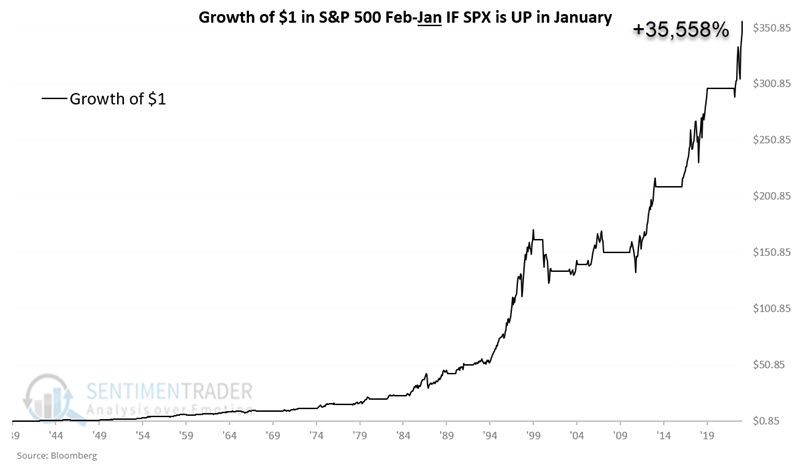
Strategy A: If January shows a gain for the S&P 500 Index, hold stocks for 12 months (i.e., through the end of January next year) instead of 11 months
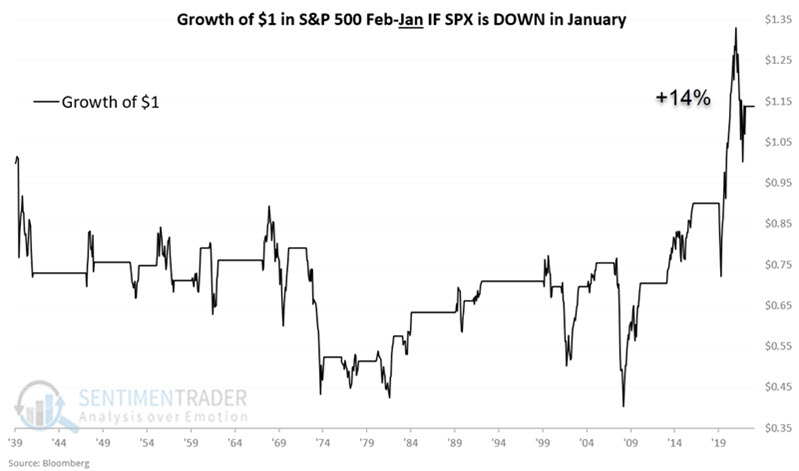
Strategy B: If January shows a loss for the S&P 500 Index, avoid stocks for 12 months (i.e., through the end of January next year)
The chart below displays the growth of $1 using Strategy A. The cumulative gain almost doubles - from +18,169% to +35,558%.
The chart below displays the growth of $1 using Strategy B. The cumulative gain was +14%.
The table below summarizes the performance of Strategy A and Strategy B.

The results above strengthen the suggestion that stock market performance in January tends to offer a clue to performance in the year ahead.
Turning the January Barometer into a model
It is not necessarily recommended that any form of the January Barometer be used as a standalone trading model for an entire portfolio using a "100% in stocks OR 100% in cash" approach. Nevertheless, it might make sense for a portion of a portfolio or as a critical piece of a "weight of the evidence" approach.
With this in mind, I found a simple, systematic way to improve on the results above:
- Hold the S&P 500 Index during January every year
- If January shows a gain for the S&P 500 Index, hold stocks for 12 months (i.e., through the end of January next year)
- If January shows a loss for the S&P 500 Index, be out of stocks for 11 months (i.e., through the end of December of that year)
First, the good news. The chart below displays the growth of this new approach (holding for 12 months instead of 11 months if January is up - black line) and the original approach holding for 11 months if January is up - blue line).
NOTE: Data is updated through 2024-01-25.
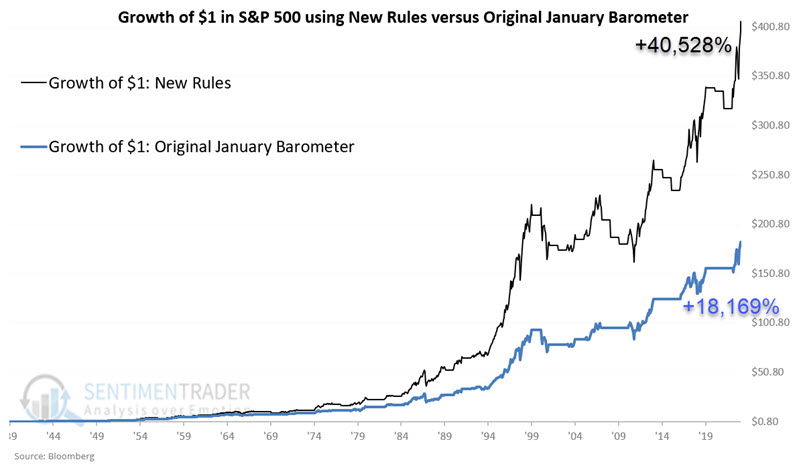
This new approach registered a gain of +40,528% versus +18,169% for the "out in January, in or out the rest of the year based on January performance" approach.
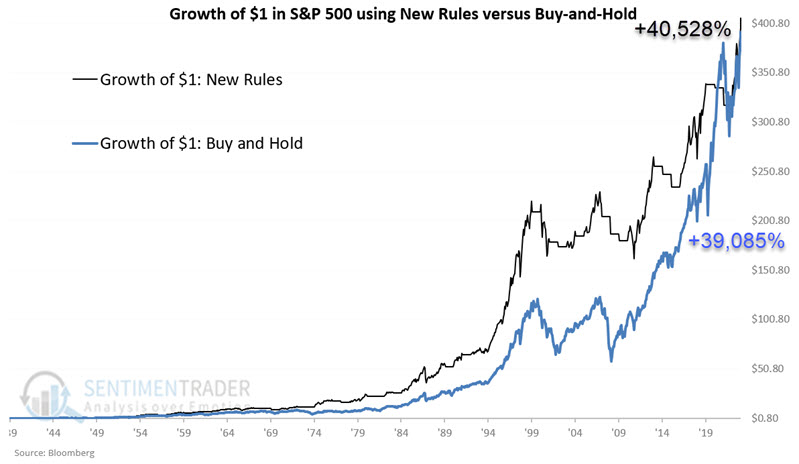
This method also slightly outperformed buy-and-hold (+40,528% versus +39,085%) as shown below.
One last tweak
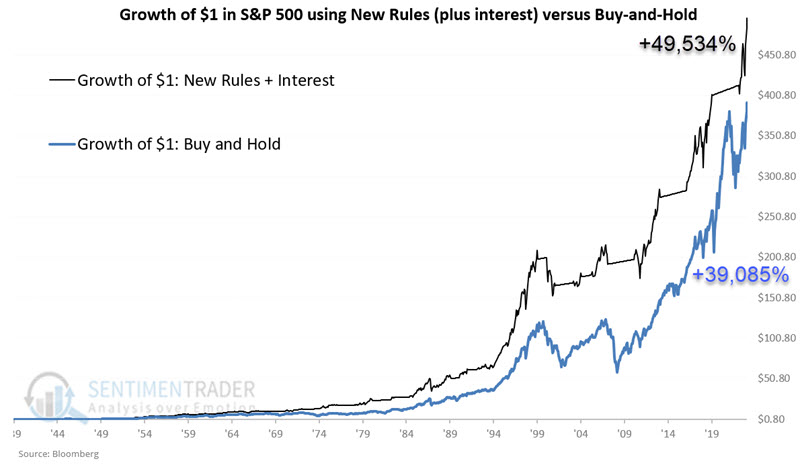
One last consideration: To make this more of a trading model, let's assume that interest is earned on cash while out of stocks. To make just a minimal assumption, let's use the following rules:
- Hold the S&P 500 Index during January every year
- If January shows a gain for the S&P 500 Index, hold stocks for 12 months
- If January shows a loss for the S&P 500 Index, remain out of stocks for 11 months and earn an annualized rate of interest of 1%
Historically, in most years, it would have been quite possible to earn a higher rate of interest. But for our purposes, we want to see what effect a minimal return on cash while out of the market might have on overall results.
The chart below displays the growth of $1 in this latest approach versus buy-and-hold. The interest-earning model gained +49,534% versus +39,085% for buy-and-hold.
What the research tells us...
Barring a significant sell-off in the final days of January 2024, the S&P 500 Index appears poised to register a higher close for the month. The reality is that this guarantees nothing for the year ahead. But the stock market is never about guarantees or certainties; it is a game of odds. Based on market history, a higher close for the S&P 500 Index in January 2024 falls firmly on the favorable side of the weight of the evidence ledger. It also strongly suggests that investors give the bullish case the benefit of the doubt in the year ahead.