Data &
Technology
Research
Reports
Report Solutions
Reports Library
Actionable
Strategies
Free
Resources
Simple Backtest Calculator
Simple Seasonality Calculator
The Kelly Criterion Calculator
Sentiment Geo Map
Public Research Reports
Free Webinar
Pricing
Company
About
Meet Our Team
In the News
Testimonials
Client Success Stories
Contact
Log inLoginSign up
< BACK TO ALL REPORTS

Similarities between the NASDAQ now and in February

Troy Bombardia
2020-06-24
The NASDAQ's non-stop rally, particularly in tech stocks, is driving some comparisons between now and other ominous historical periods.

The NASDAQ's non-stop rally, particularly in tech stocks, is driving some comparisons between now and other ominous historical periods. I noted yesterday that relatively few of the S&P's members are above their 200 dma. Callie Cox was the first to mention this problem, and it's even worse for the NASDAQ than the S&P 500. The NASDAQ Composite is more than 16% above its 200 dma (i.e. a massive rally) while a mere 45% of NASDAQ members are above their 200 dma. Such weak NASDAQ breadth in the face of such a strong rally has never happened before from 2001-present:

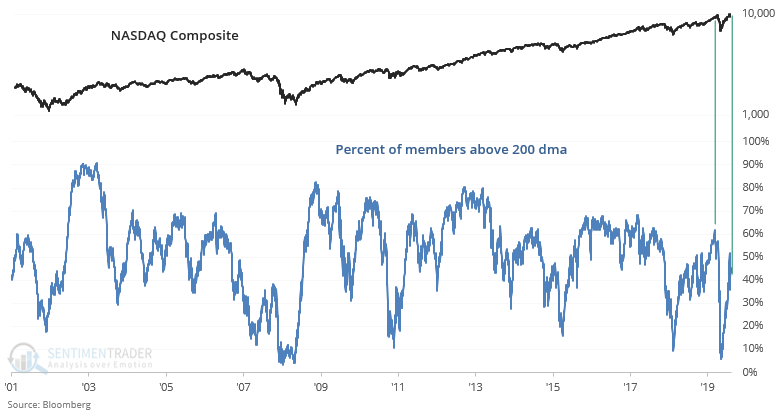
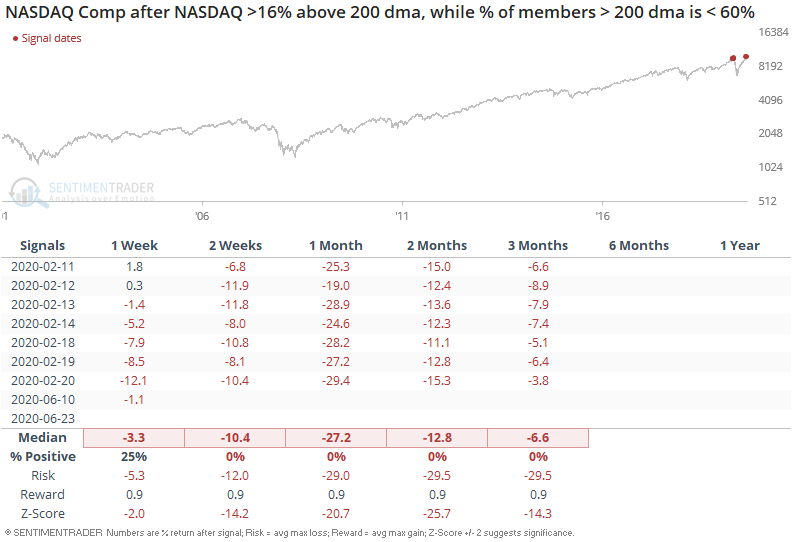
The only somewhat comparable case was in February, just before the U.S. stock market fell off a cliff. Even comparing today vs. February is a bit of a stretch: breadth today is much worse than it was back then:

It's not hard to figure out why the NASDAQ's breadth is so weak. Internet stocks are on FIRE, while other stocks are languishing. Robinhood traders must be having a field day as the NASDAQ Internet Index SOARS. Who knew that making 10% each week in trading would be so easy (insert eye roll). Here's an excellent interview with Robinhood for those who are interested in fintech. Always remember: if a product is free, you are the product.

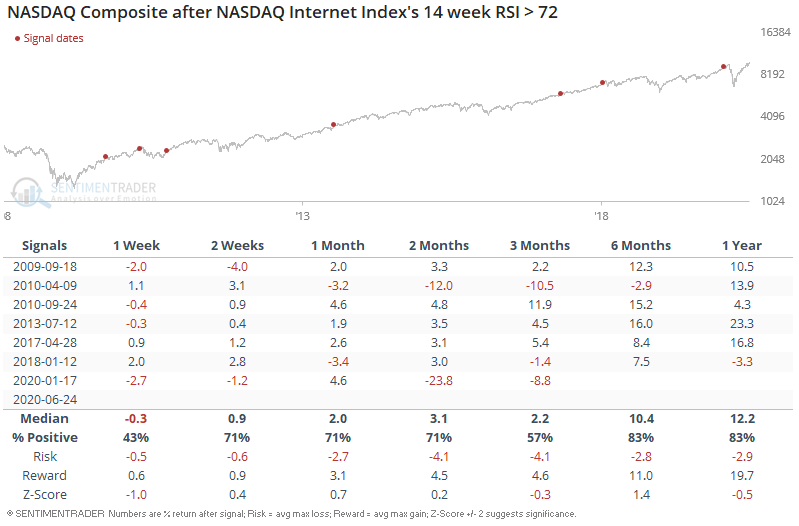
With that being said, the NASDAQ Internet Index's 14 week RSI is at the highest level since earlier this year:

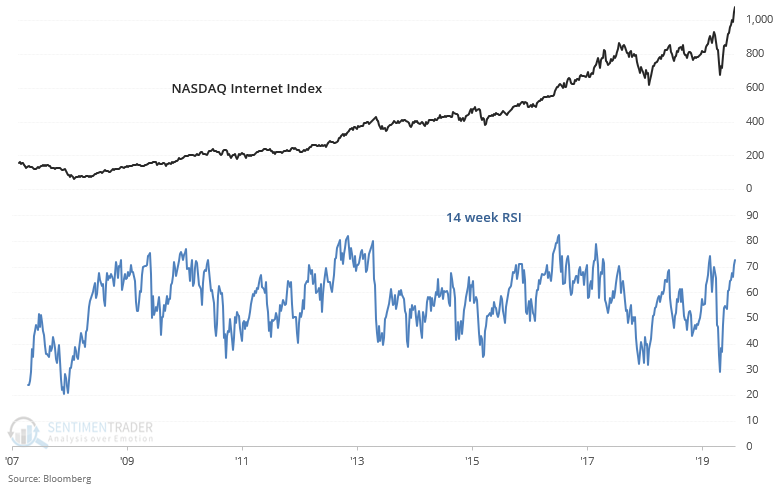
Such strong momentum has been a consistent bearish factor for the NASDAQ Composite, although the past 2 cases (January 2018 and January 2020) were followed by sharp market declines:

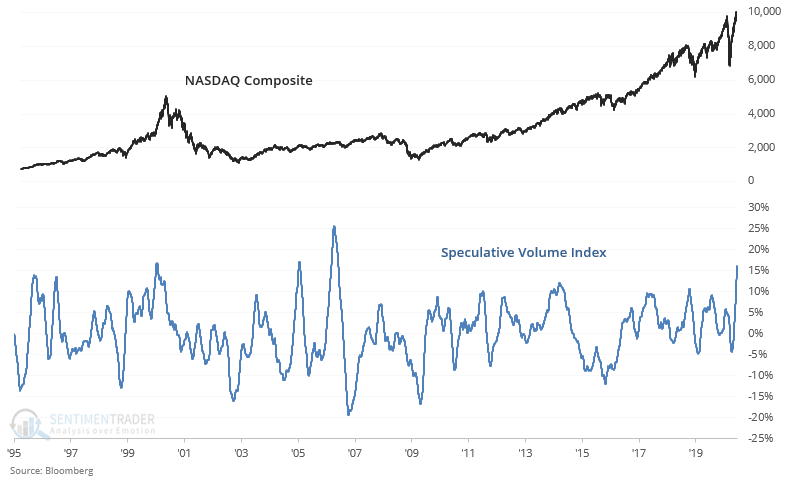
A few years ago Jason looked at a concept called the Speculative Volume Index. This indicator looks at the difference between volume on the NYSE vs. NASDAQ exchanges. The theory is that NASDAQ stocks are more speculative, so when trading activity on the NASDAQ surged relative to activity on the NYSE, it's a sign of excess speculation.

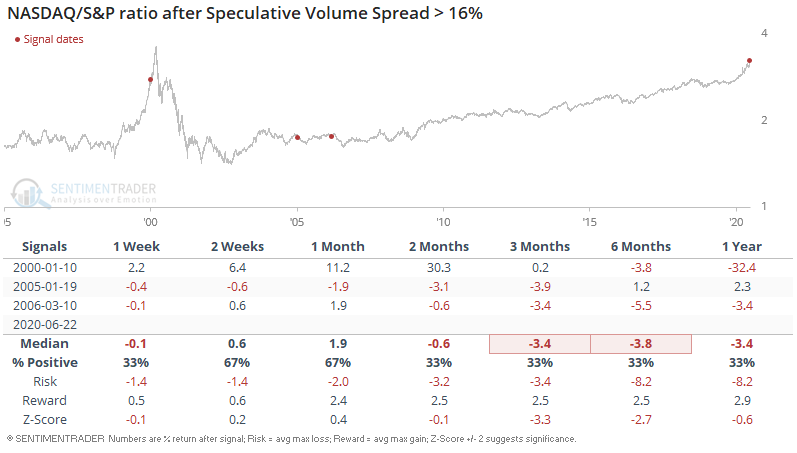
We can use this concept to compare volume for the NASDAQ vs. the S&P 500. The following compares the 50 day average of the NASDAQ/S&P Volume ratio against its 200 day average. Speculation towards tech stocks is at its highest level in over a decade: 

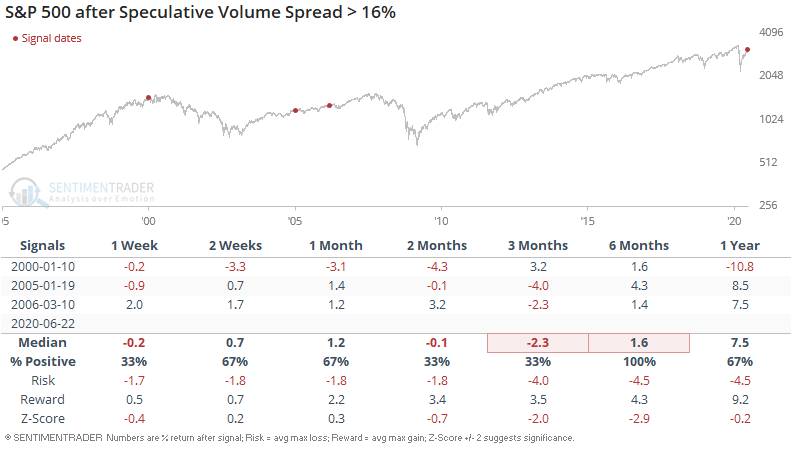
Such an extreme level of relative speculation has only been matched by 3 other times over the past 25 years. All 3 of these cases led to a pullback in the S&P over the next 2-3 months:

And all 3 led to a pullback in the NASDAQ over the next 3-6 months:

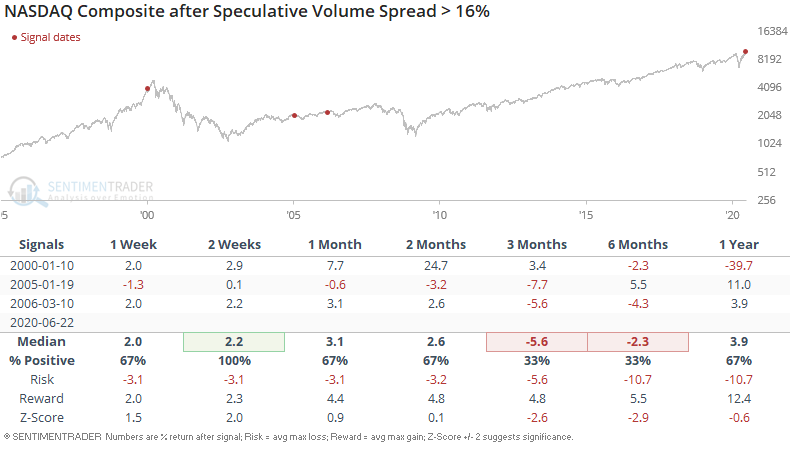
And as one might expect, this caused the NASDAQ to underperform the S&P 500 over the next 3-6 months:

Sorry, you don't have access to this report

Upgrade your subscription plan to get access
Go to Dasboard
DATA &
TECHnologies
IndicatorEdge
‍
BackTestEdge
‍
Other Tools
‍
DataEdge API
RESEARCH
reports
Research Solution
‍
Reports Library
‍
actionable
Strategies
Trading Strategies
‍
Smart Stock Scanner
‍
FREE
RESOUrCES
Simple Backtest
Calculator
Simple Seasonality
Calculator
The Kelly Criterion
Calculator
Sentiment Geo Map
‍
Public Research Reports
‍
Free Webinar
COMPANY
‍
About
‍
Meet our Team
‍
In the News
‍
Testimonials
‍
Client Success Stories
Pricing
Bundle pricing
‍
Announcements
‍
FAQ
© 2024 Sundial Capital Research Inc. All rights reserved.
Setsail Marketing
TermsPrivacyAffiliate Program
Risk Disclosure: Futures and forex trading contains substantial risk and is not for every investor. An investor could potentially lose all or more than the initial investment. Risk capital is money that can be lost without jeopardizing ones’ financial security or life style. Only risk capital should be used for trading and only those with sufficient risk capital should consider trading. Past performance is not necessarily indicative of future results.

Hypothetical Performance Disclosure: Hypothetical performance results have many inherent limitations, some of which are described below. No representation is being made that any account will or is likely to achieve profits or losses similar to those shown; in fact, there are frequently sharp differences between hypothetical performance results and the actual results subsequently achieved by any particular trading program. One of the limitations of hypothetical performance results is that they are generally prepared with the benefit of hindsight. In addition, hypothetical trading does not involve financial risk, and no hypothetical trading record can completely account for the impact of financial risk of actual trading. for example, the ability to withstand losses or to adhere to a particular trading program in spite of trading losses are material points which can also adversely affect actual trading results. There are numerous other factors related to the markets in general or to the implementation of any specific trading program which cannot be fully accounted for in the preparation of hypothetical performance results and all which can adversely affect trading results.

Testimonial Disclosure: Testimonials appearing on this website may not be representative of other clients or customers and is not a guarantee of future performance or success.