
Similar patterns raise the importance of the next couple weeks

Key points:
- Over the past few months, the S&P 500's dramatic decline and recovery closely resemble 15 other periods
- The volatility has caused a rapid increase in the Discouragement phase of a Typical Sentiment Cycle
- Investors' reactions over the next couple of weeks had a high positive correlation to long-term returns
What a few months it has been
Stocks took a beating, then roared back. Both were of a magnitude and speed rarely seen over nearly 100 years.
During the S&P 500's history, there have been 15 periods closely correlated to this pattern. Each instance's correlation was at least +0.8 on a scale of -1.0 to +1.0. Perhaps due to the increasing speed of market movements, half the cases have been triggered in the last 30 years.
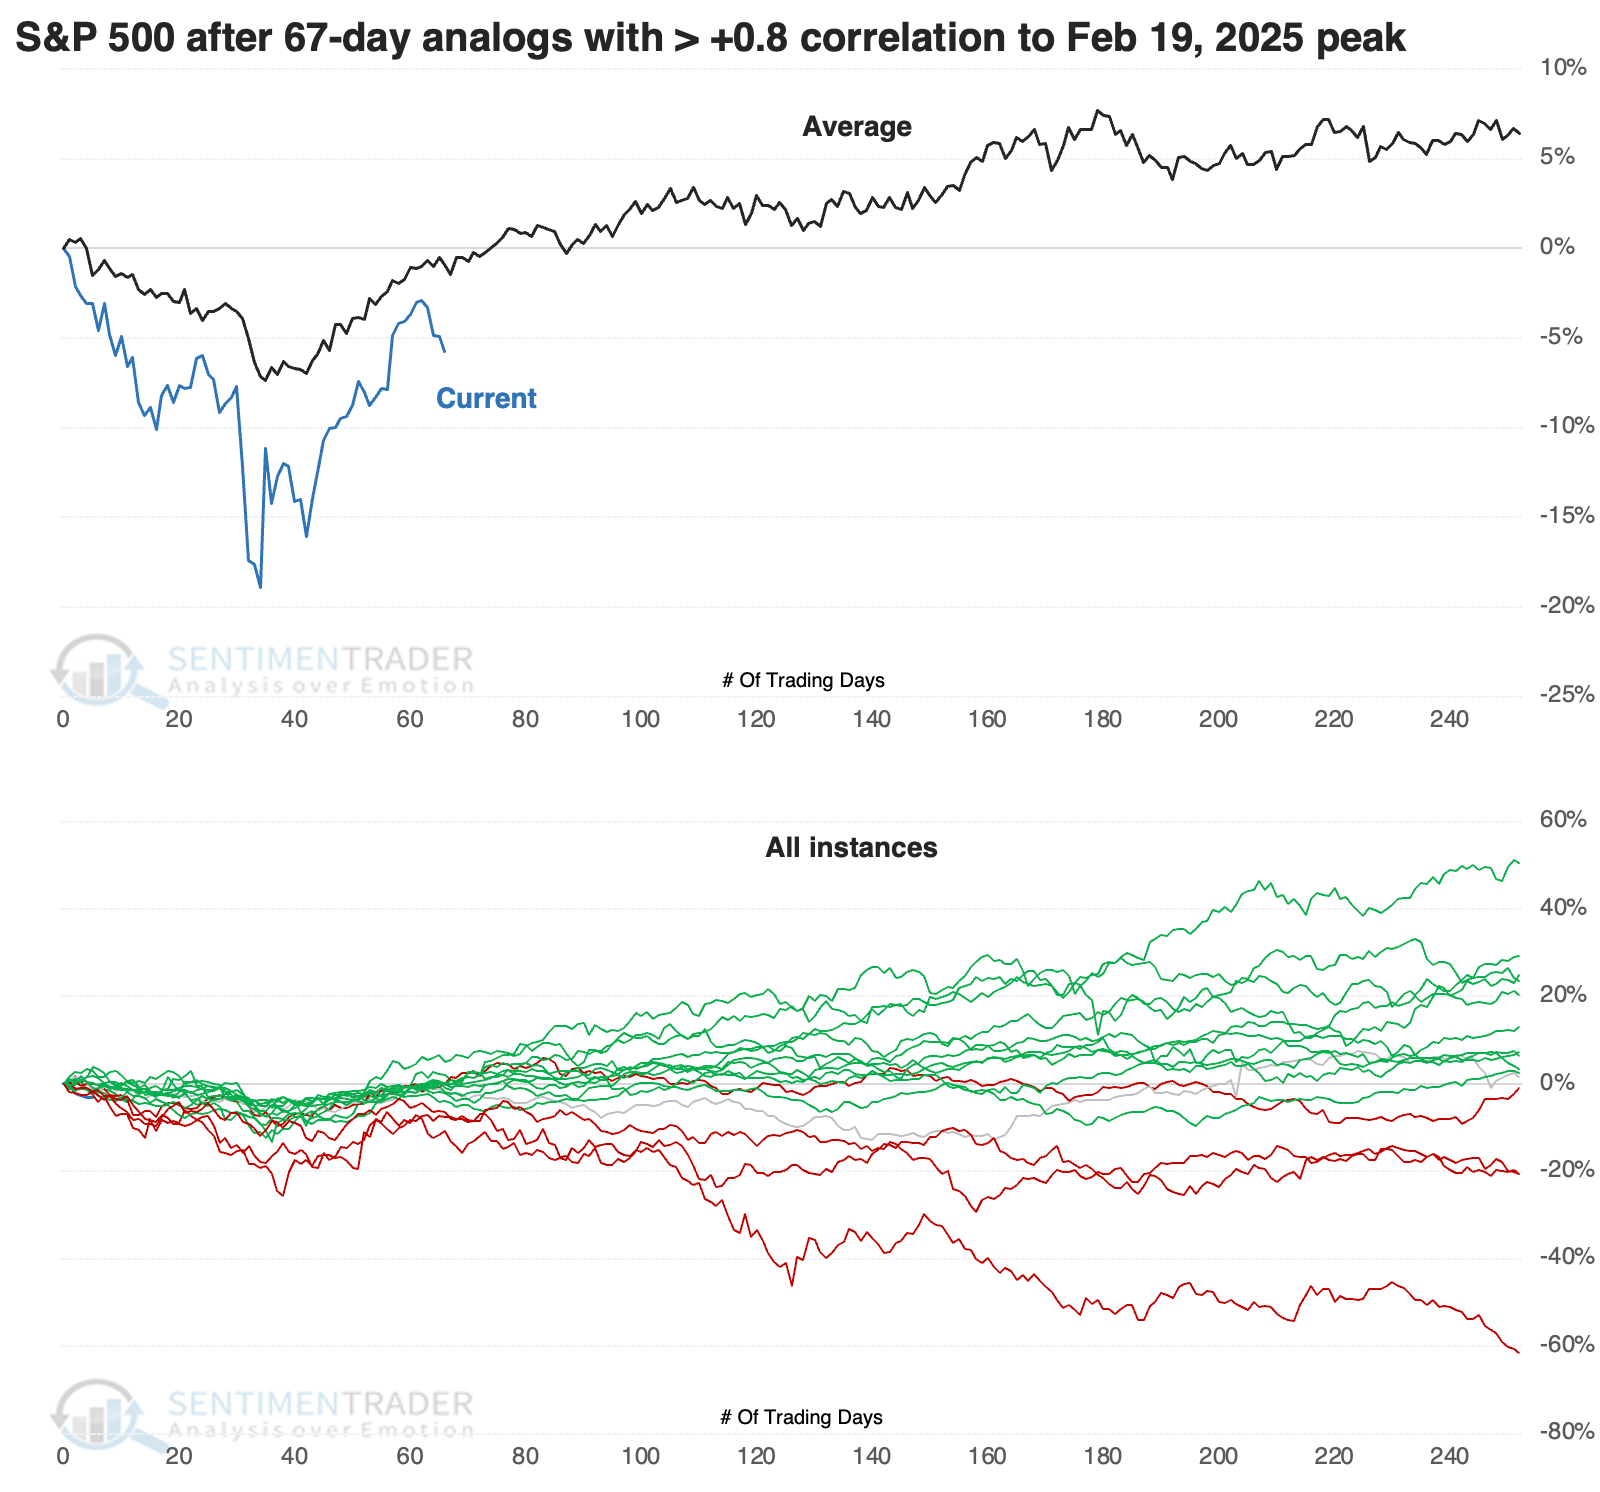
The chart below shows the S&P's current path since its peak, along with the average and individual paths of its highest-correlated analogs.
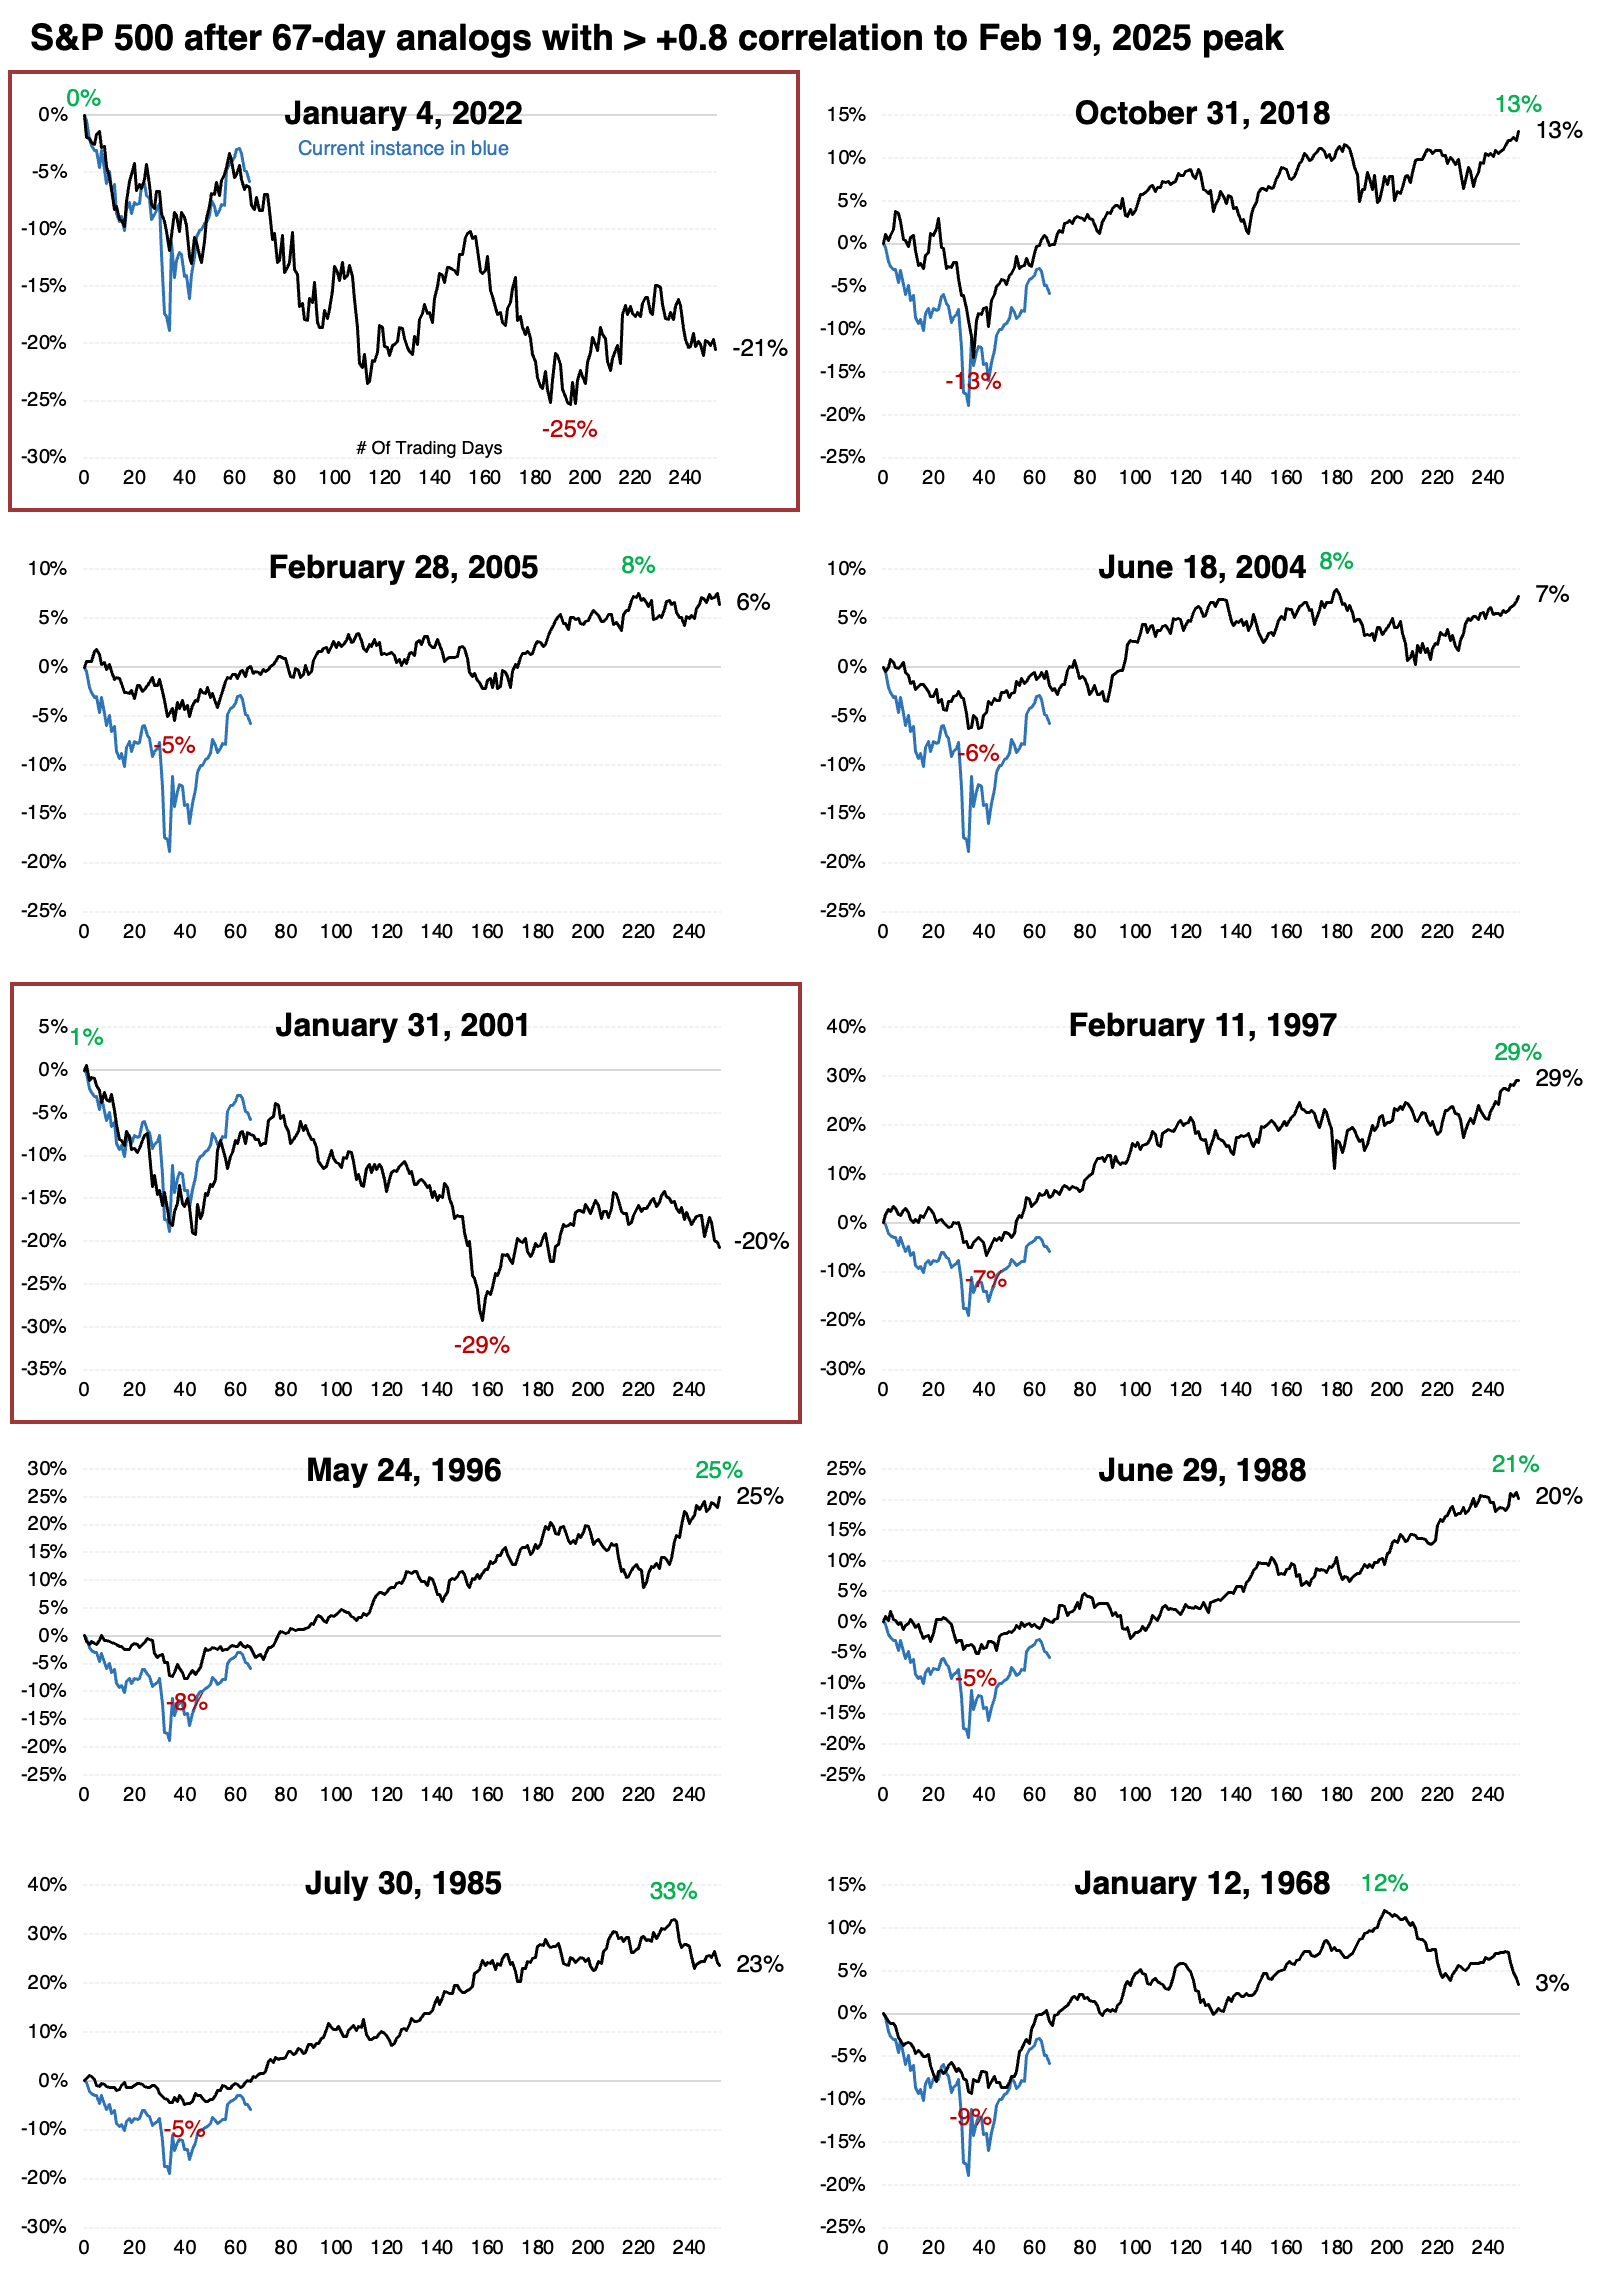
Below are thumbnails of the ten most recent instances. It's somewhat troubling that the two closest matches in speed and magnitude of the decline and rally were 2022 and 2001. The S&P's analog fits both almost perfectly, and both peaked right about now.
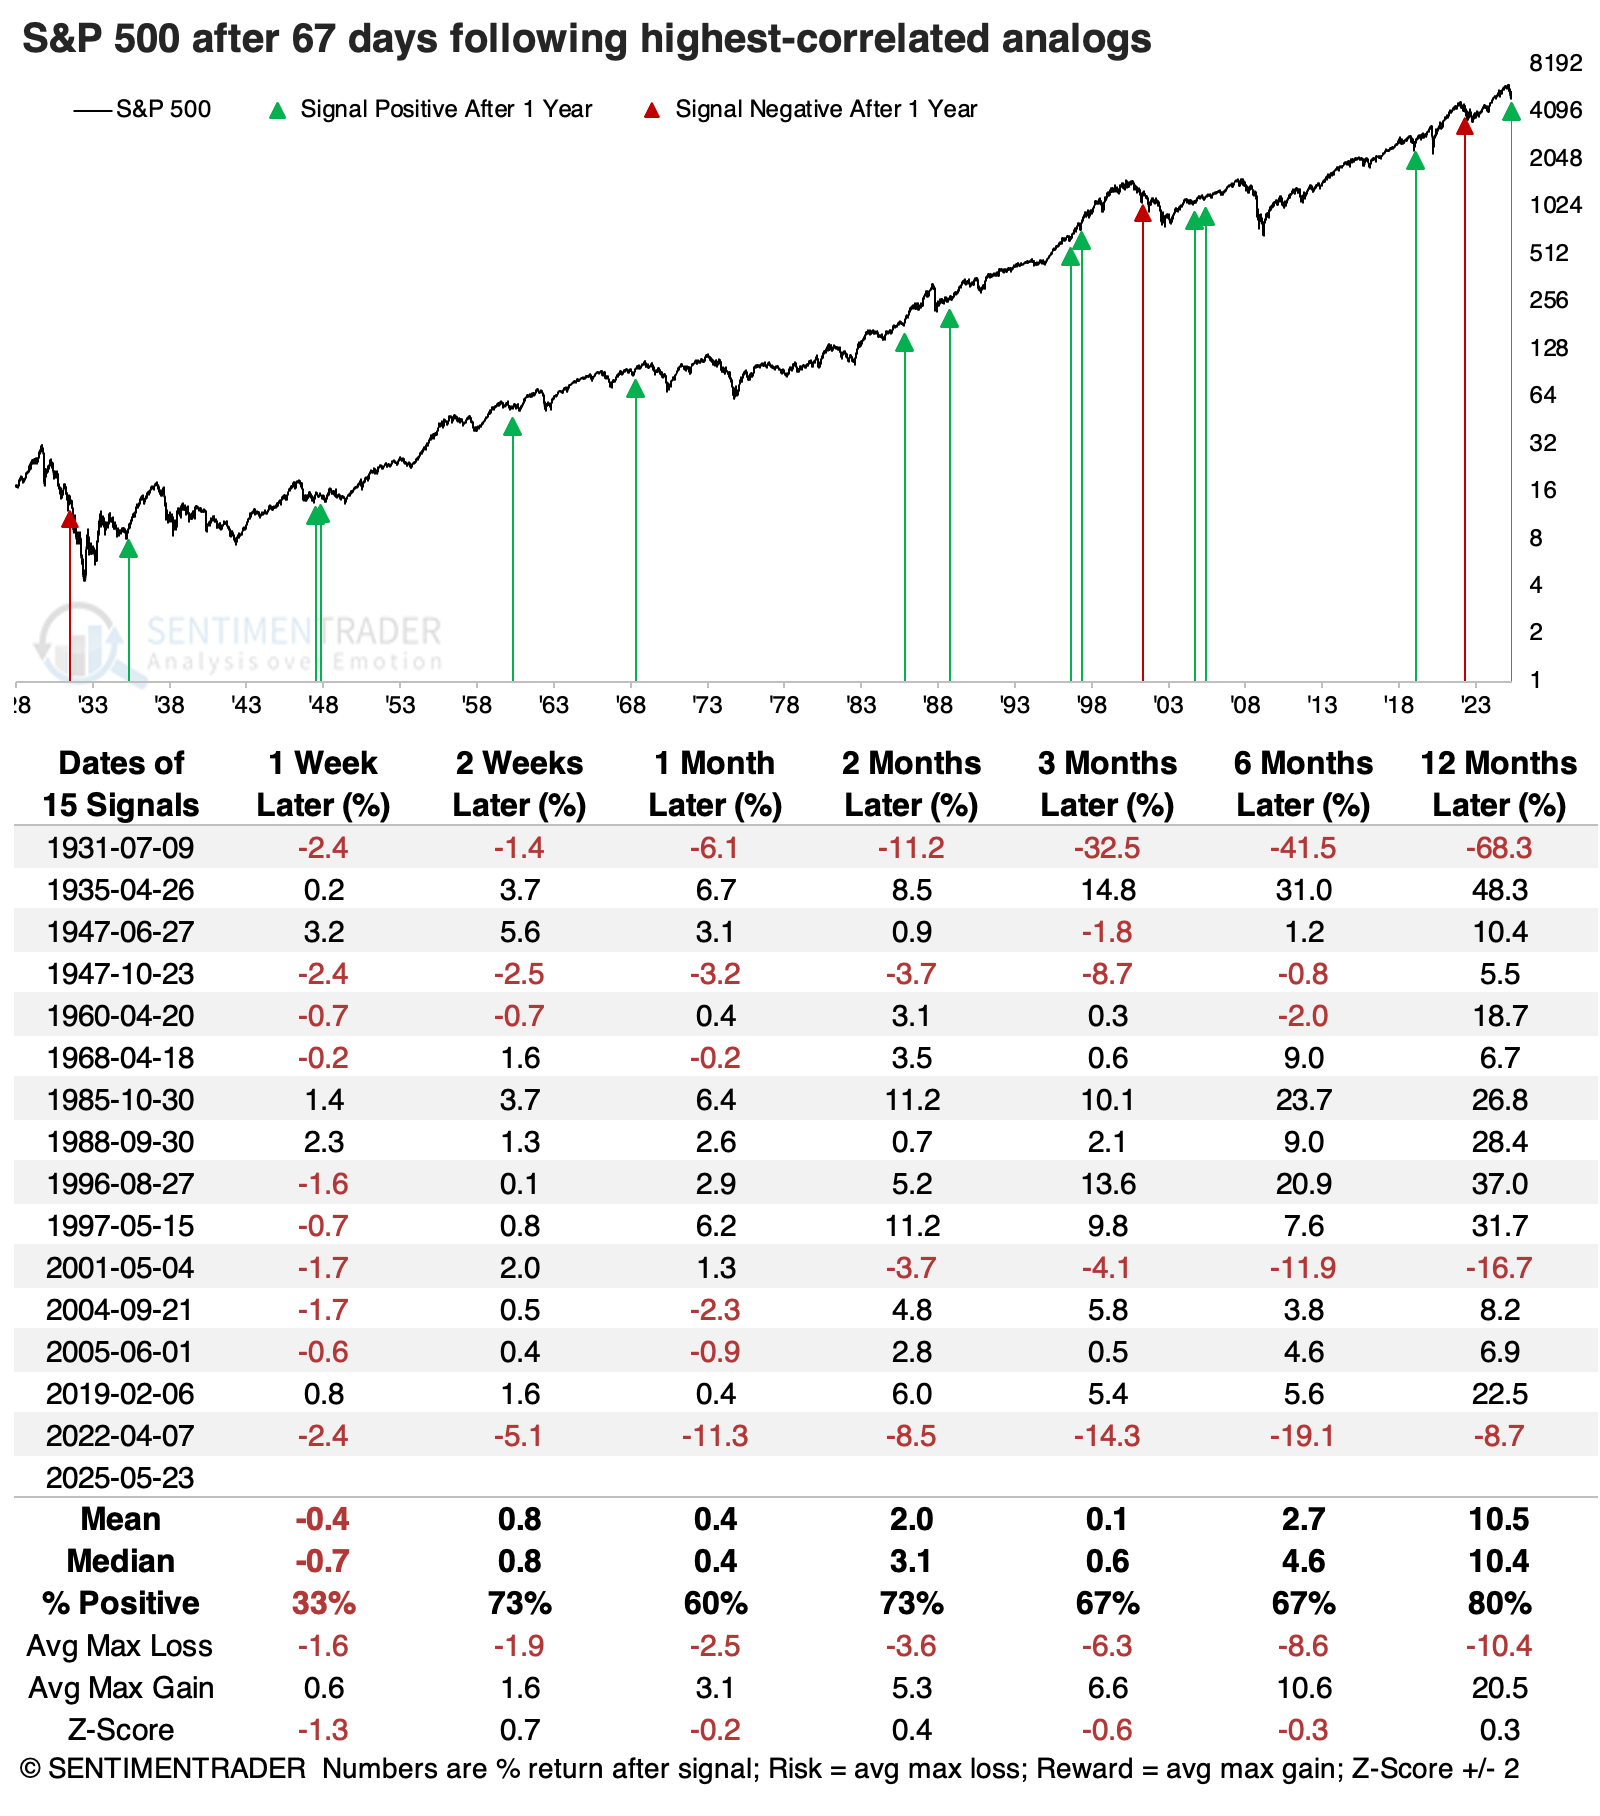
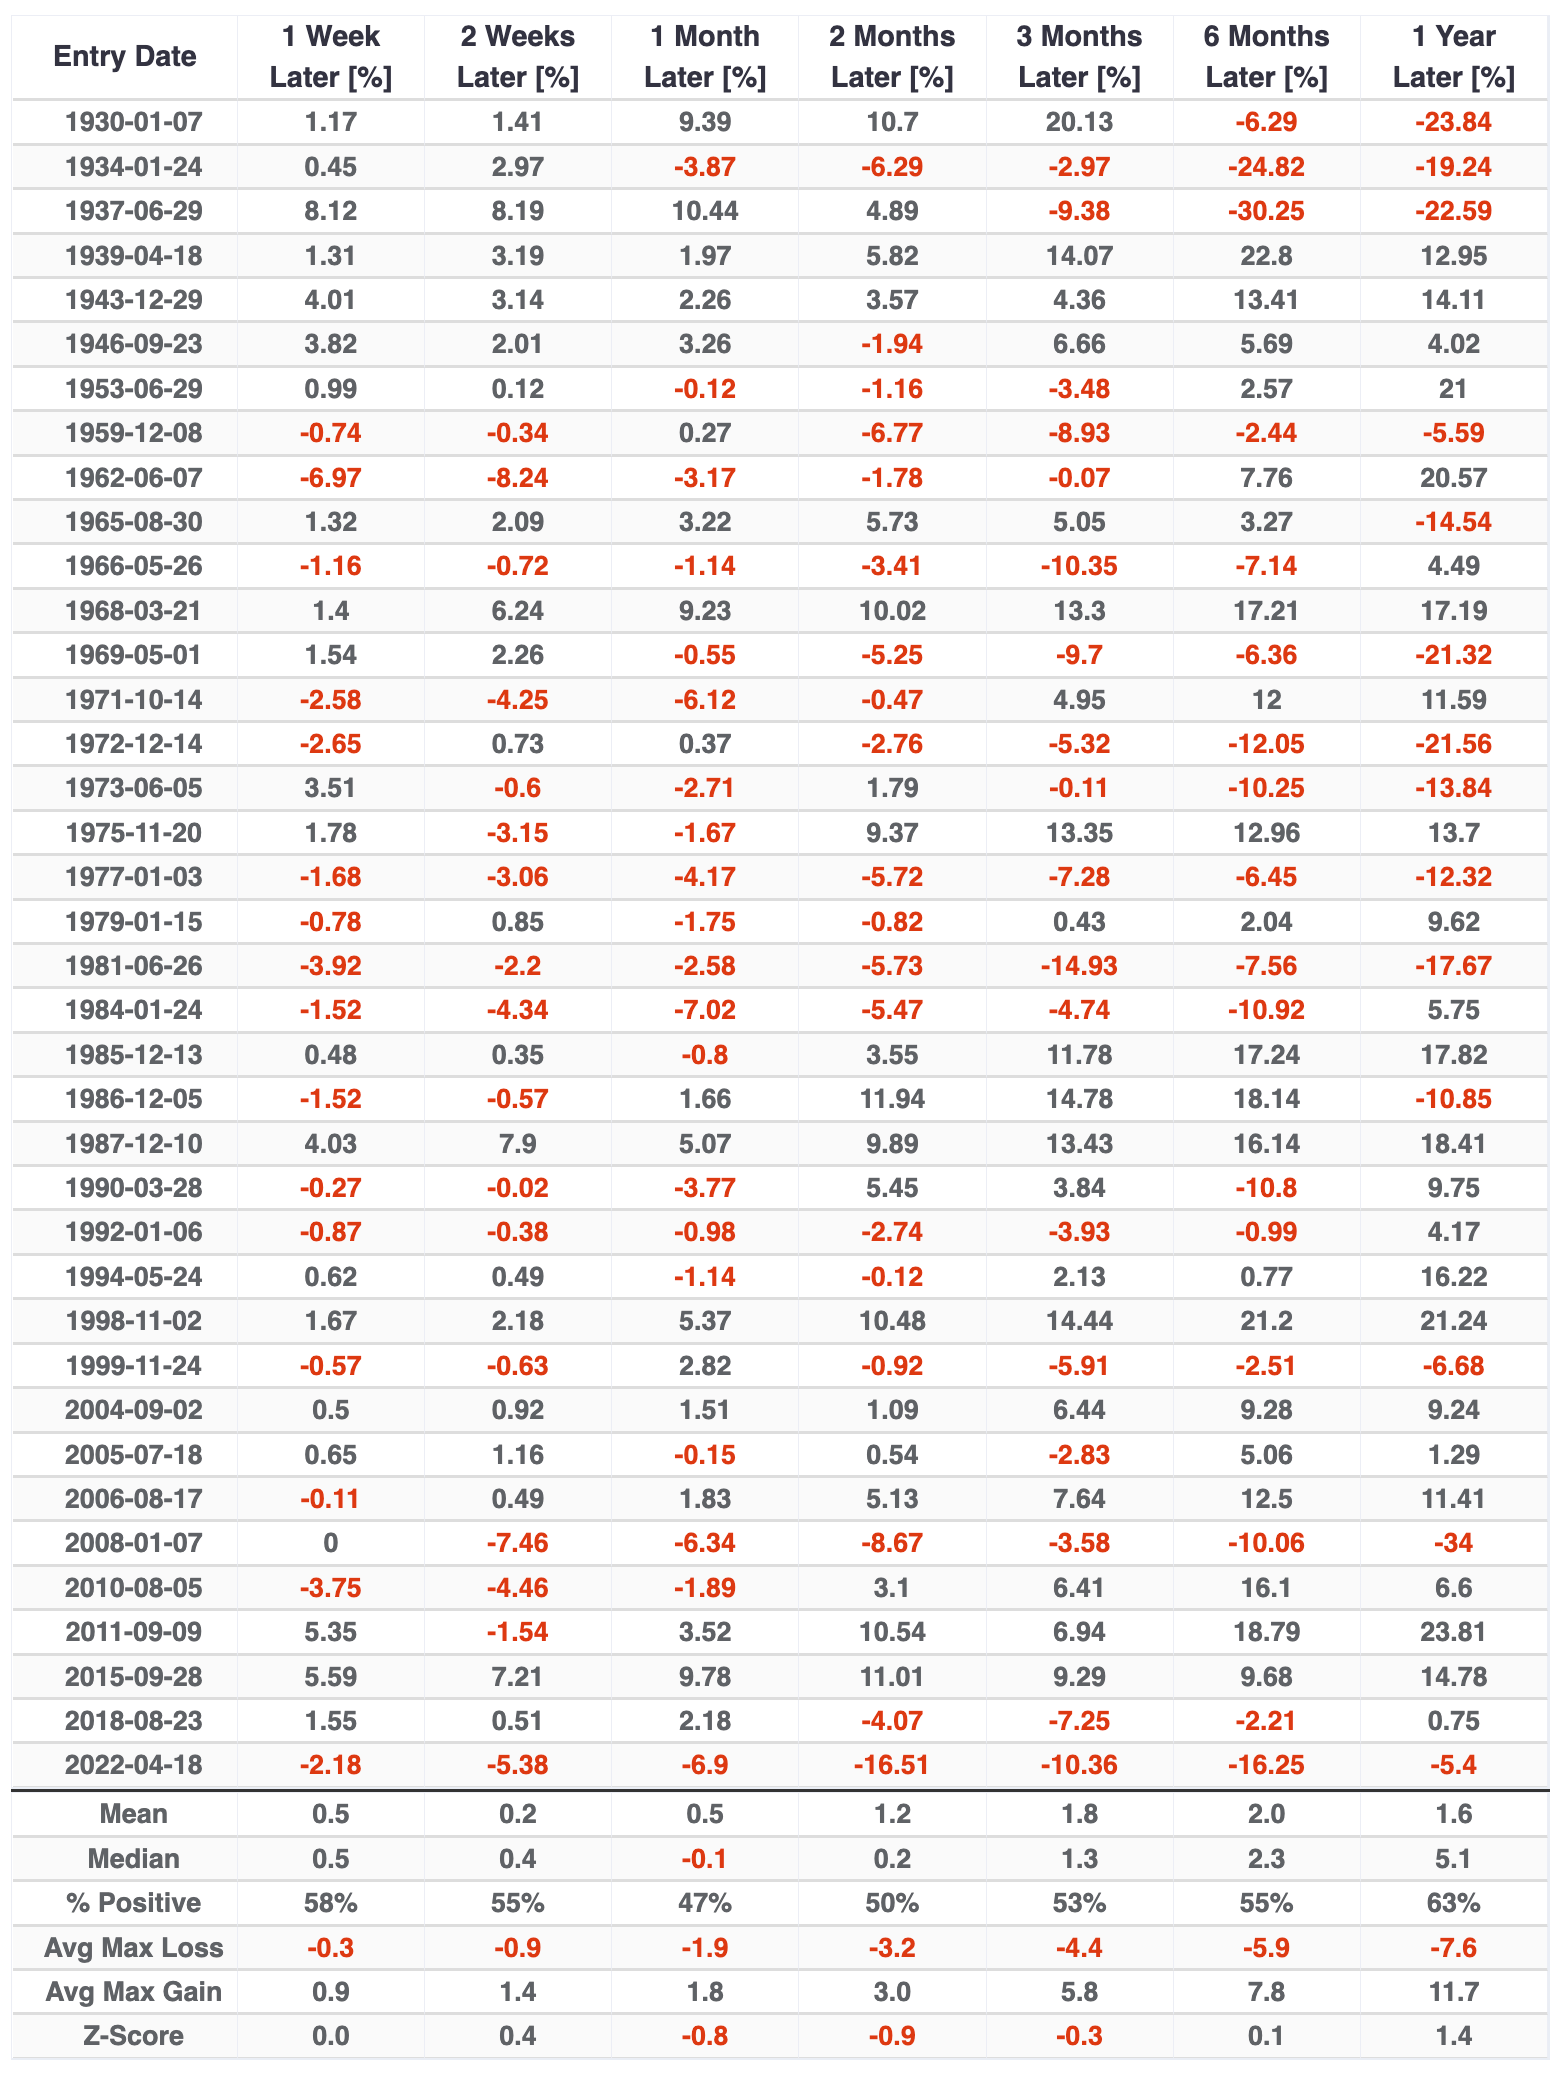
It's been 67 days since the peak, so the table below shows forward returns from where the pattern ends. Very short-term returns were poor, but quickly turned around after that...most of the time. There were a few significant failures, with double-digit losses over the following six to twelve months, including the last signal at the start of the 2022 bear market.
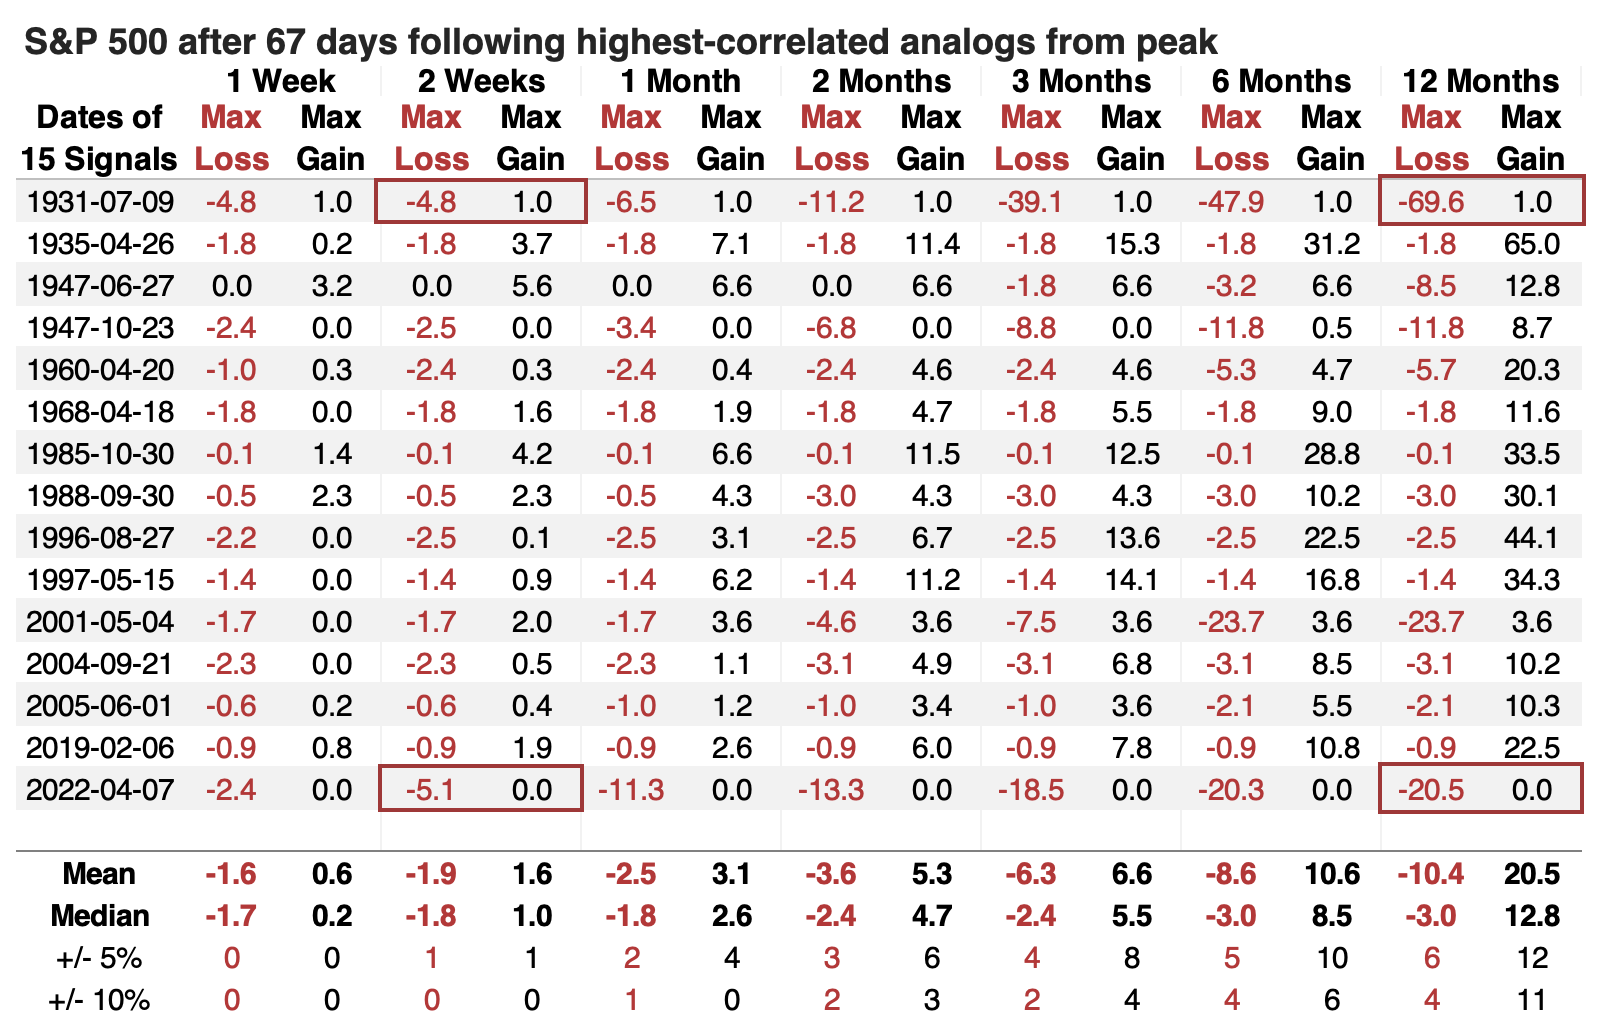
The table of risk versus reward across time frames shown below highlights that the two instances with the worst performance over the following two weeks also preceded the worst risk/reward over the following year. The worst markets saw almost no upside over the next two weeks, and drawdowns of at least -4.5%.
The other poor performer, in 2001, was deceptive. The S&P 500 suffered a loss over the next week, then jumped several percent, suggesting the worst was over. But it soon peaked, and the "it's not a bear market rally" crowd faced hefty losses.
With few samples and a false positive, it's hard to rely too much on this, but it does hint at the idea that if buyers are willing to persist over the next couple of weeks, it may be another brick in the foundation of a sustainable bull market.
Discouragement is rising
Despite the recent rally, but because of the sharp decline preceding it, price behavior is starting to reflect the Discouragement phase of a Typical Sentiment Cycle more closely. The last three instances preceded volatile conditions for the S&P 500 before sustained rallies.
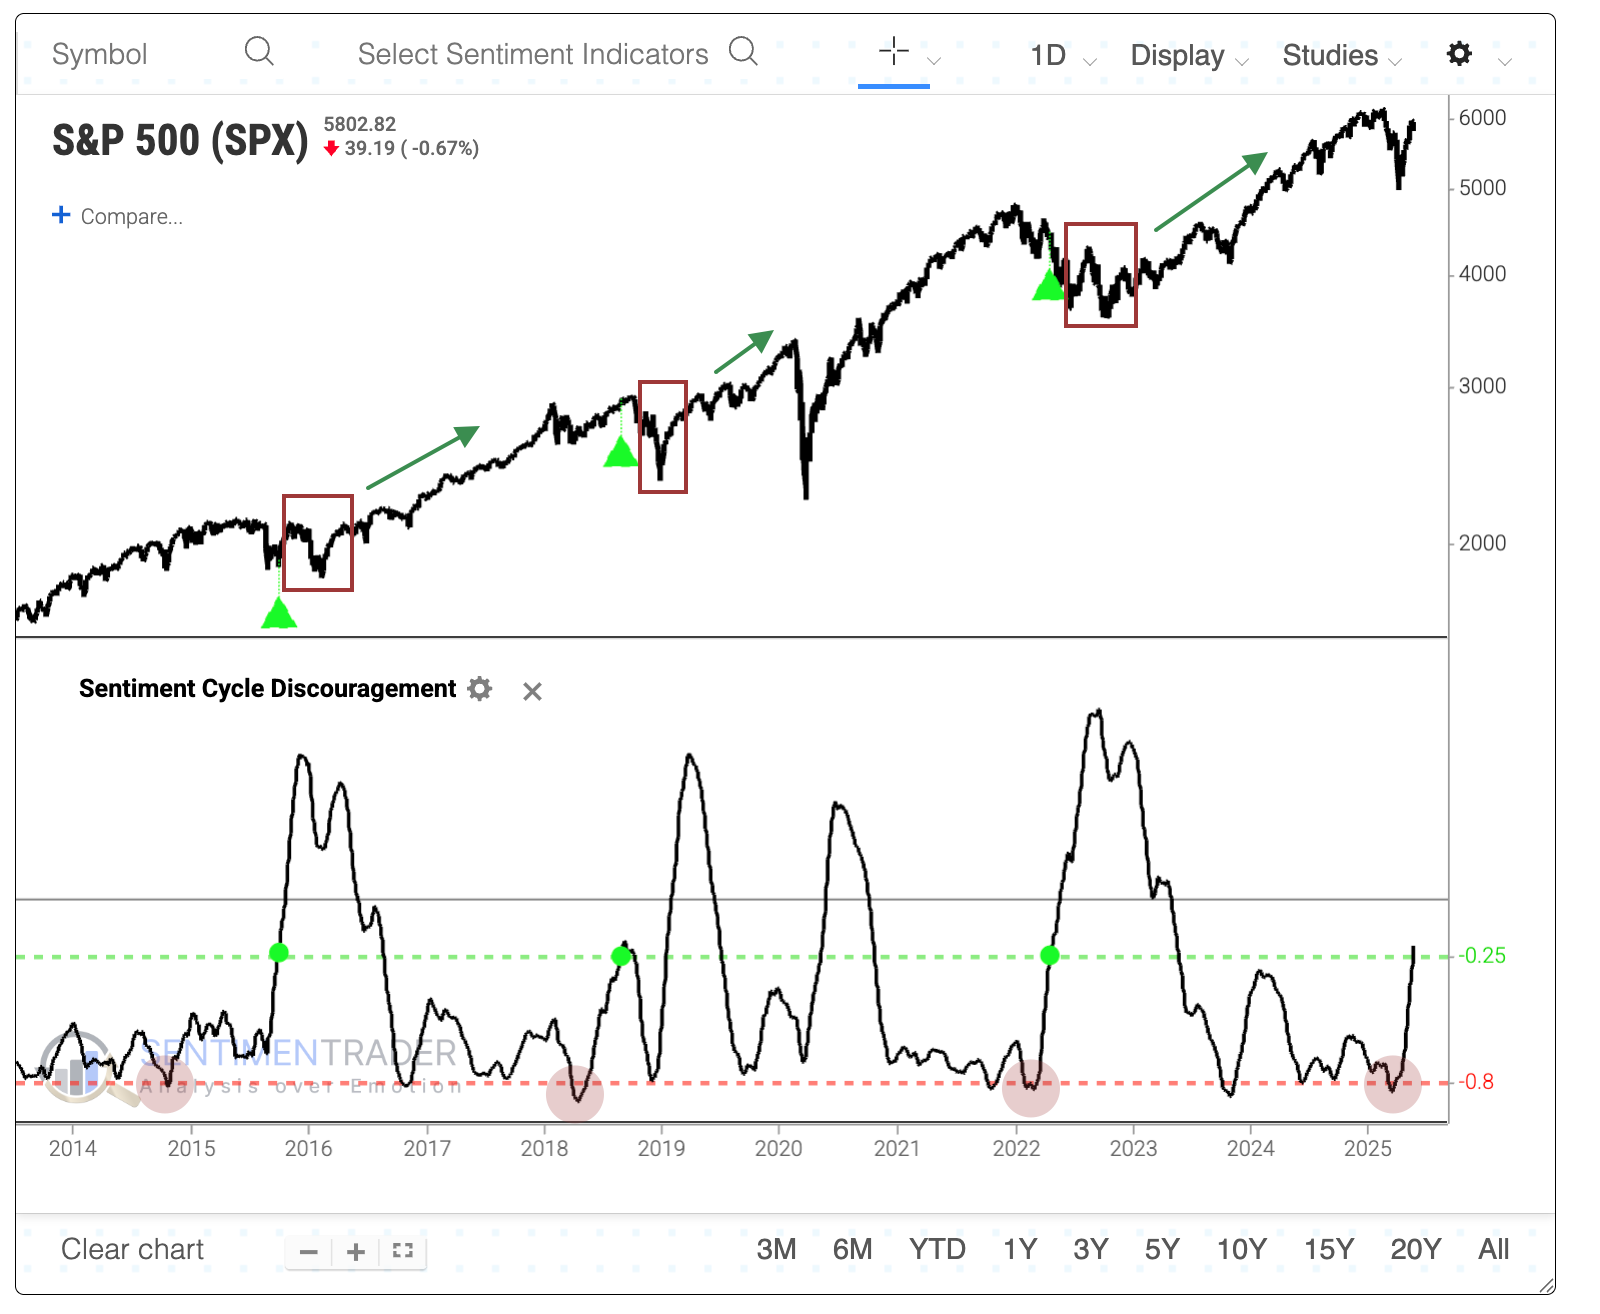
The backtest engine can help us identify other times when the pattern went from heavily uncorrelated to less so. These are times when the price action looked like confusing times for investors, which typically means either increasingly choppy conditions or times of upheaval when investors had a hard time committing either way. It tested when the Discouragement phase went from -0.8 correlation to above -0.25.
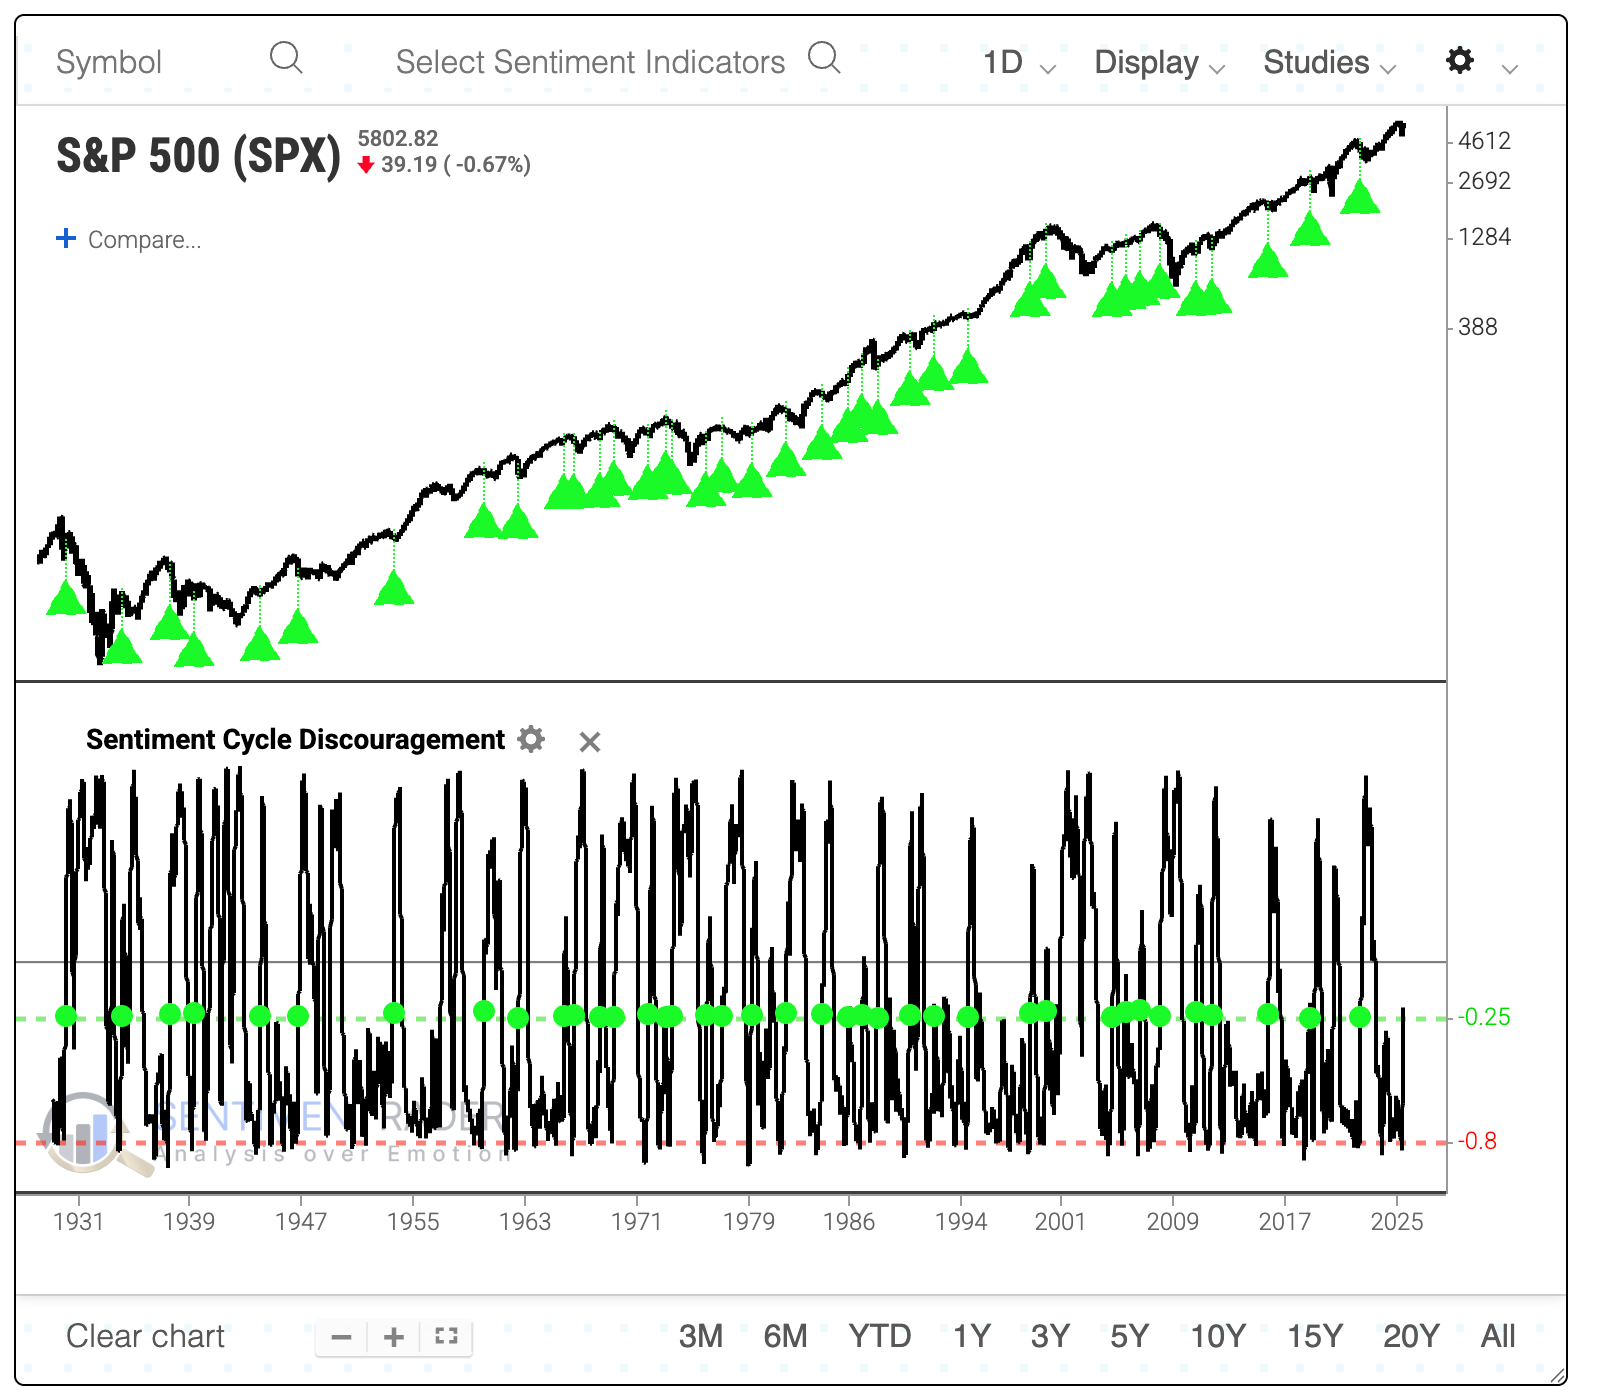
Overall, the S&P's returns were inconclusive. It tended to be mildly weak over the following month. Before and after that, returns were about in line with random returns with a slightly below-average probability of being positive. Over the past 40 years, a very high positive correlation existed between the S&P 500's drawdown over the following two weeks and its absolute return over the following year. This means that the bigger the short-term drawdown, the less likely the index would recover to show a large positive long-term return.
What the research tells us...
As we've outlined in numerous studies over the past month, the push off the April low has been historically impressive. Most of them suggest that the thrust has been broad-based enough and quick enough to reduce the probability that we've witnessed just another bear market rally.
Markets rarely present us with a "gimmee," and this is another example. The most highly correlated analogs with the past few months have both been bear market rallies, and rising Discouragement isn't all that helpful. One of the suggestions is that if buyers continue to show interest over shorter time frames, the probability that this is a sucker's rally goes down significantly. For longer-term investors with a time frame of 6-12 months, that should increase confidence that the risk/reward continues to be positive.