
Similar patterns point to a choppy stretch ahead

Key points:
- The Nasdaq 100's drawdown is concentrated in large-cap tech
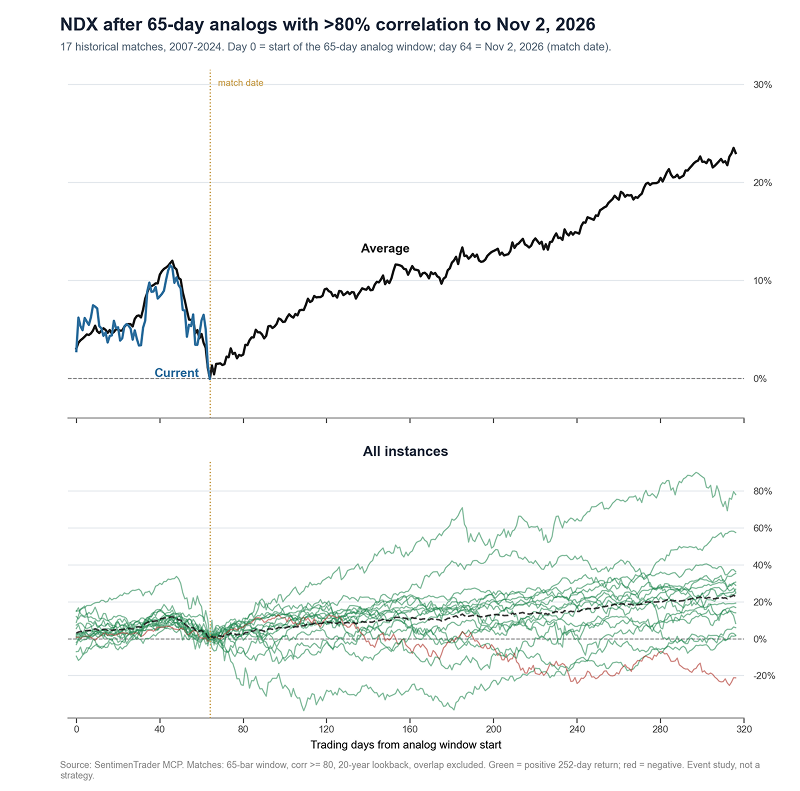
- Most matches were higher a year later, but several suffered deep interim declines
- After the same shape, the index has repaired quickly and has also kept falling for months
- The first two weeks separated the speed of the repair better than the one-year result did
The Nasdaq's solo drawdown
The Nasdaq 100 is a concentrated index. A handful of large technology companies carry enough weight that their revaluation alone can set the index's direction, even when the rest of the market does not follow.
The past three months made that gap unusually clear. The index is 10.4% below its October high, while the S&P 500 is less than 4% below its own.
A pullback of this size in tech is not unusual after a long advance. What interests us more is which historical periods this stretch resembles, and how those periods ended.
We compared the Nasdaq 100's last 65 closing prices through November 2 with every 65-day window in the past 20 years. Seventeen periods correlated at 0.8 or better.
The chart below sets the current path against the average of those matches and each case. The index rallied inside the window, then gave the gain back quickly, a pattern many of those periods share.