Products
SentimenTrader Trading Tools
‍
Backtest Engine
My Trading Toolkit
Correlation Analysis
Seasonality
Market Prediction
Indicators & Data API
‍
Proprietary Indicators & Charts
Market Data API
Strategies & Scanner
‍
50+ Trading Strategies
Smart Stock Scanner
Smart Option Scanner
Research Reports
‍
Research Solutions
Reports Library
Free Resources
Simple Backtest Calculator
Simple Seasonality Calculator
The Kelly Criterion Calculator
Sentiment Geo Map
Public Research Reports
Education
Sentiment Indicators
Technical Indicators
Pricing
Company
About
In the News
Testimonials
Client Success Stories
Contact
Log inLoginSign up
< BACK TO ALL REPORTS

Similar multi-month consolidations near a high suggest an upside breakout

Dean Christians
2025-02-14
For only the 23rd time since 1928, the S&P 500 has traded in an extremely tight range, just below a multi-year high, forming a rare two-month consolidation pattern. Similar configurations tended to result in an upside breakout, with the large-cap index rallying 77% of the time over the following two weeks.

Key points:

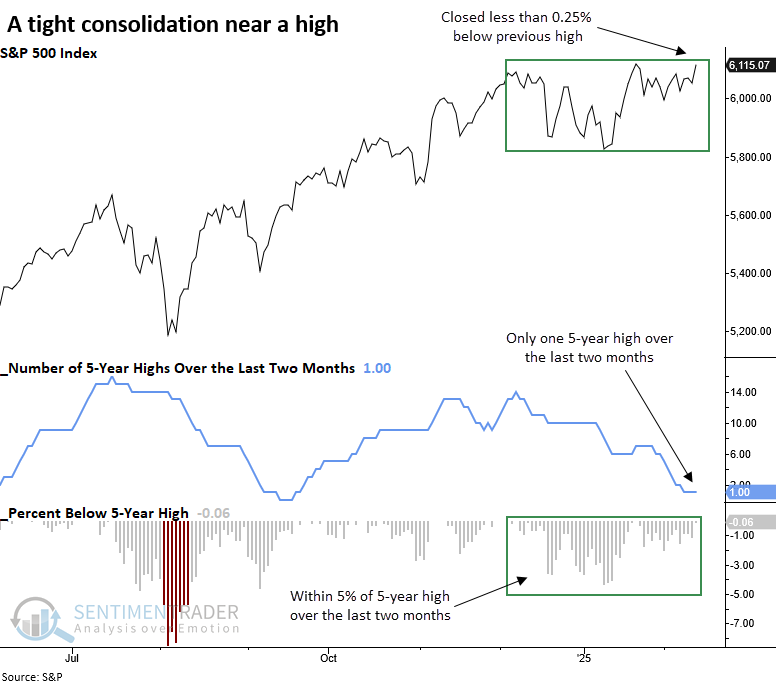
  • Over the last two months, the S&P 500 has consolidated in a tight range, recording only one high 
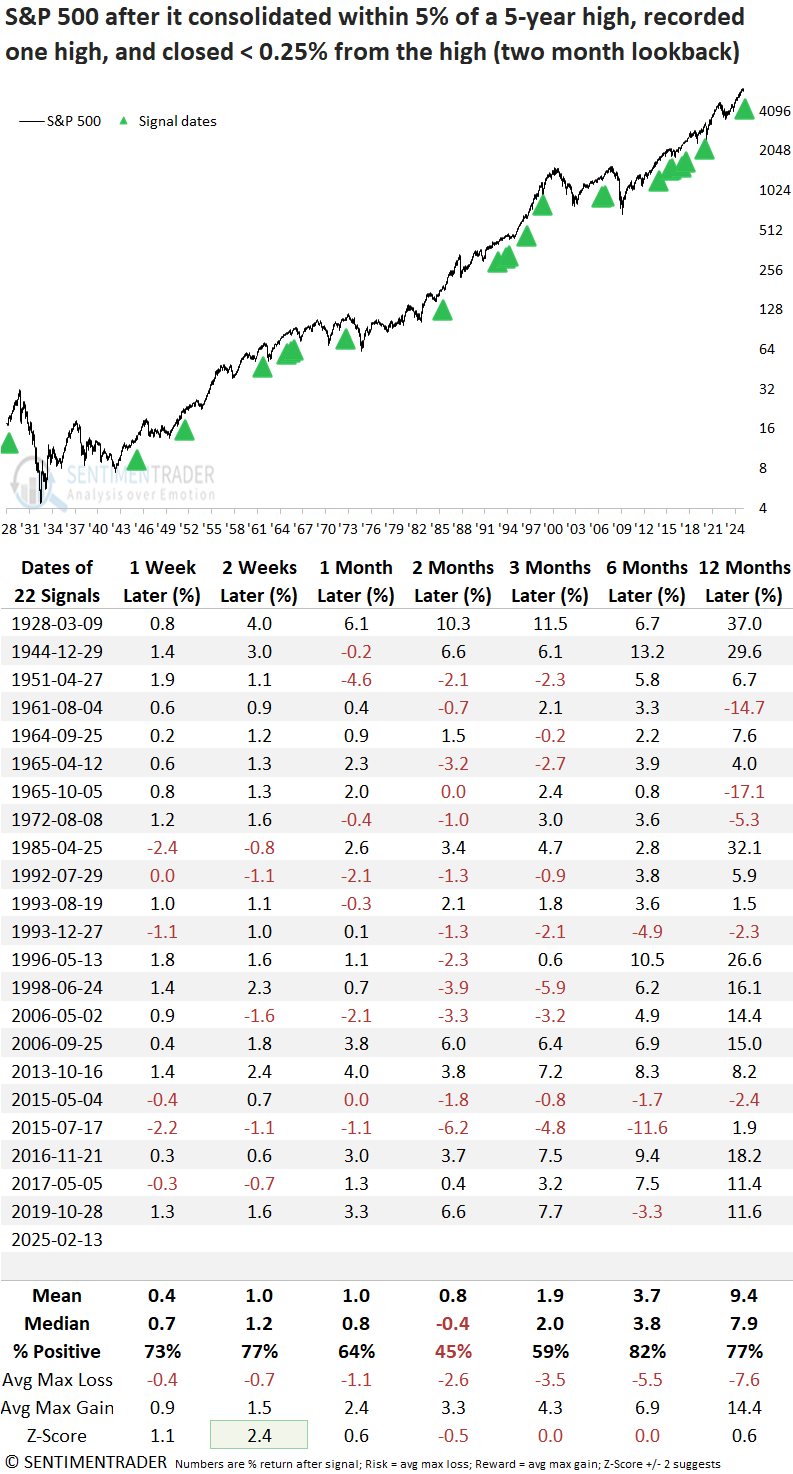
  • Similar consolidations saw the large-cap index rally 77% of the time over the subsequent two weeks

The odds favor an upside resolution from the multi-month consolidation

In a recent research report, I identified a price pattern indicating that the S&P 500 might face short-term challenges before resuming its upward trend, which historically led to a 100% win rate over two months. Consistent with that outlook, the world's most benchmarked index has exhibited choppy price action, all within the context of a broader multi-month consolidation. 

Over the past two months, the S&P 500 has remained within 5% of its record high, recording just one new high despite unsettling headlines about tariffs and the DeepSeek announcement, which briefly rattled stocks. On Thursday, it closed 0.06% below its high. 

The previous multi-month consolidation with similar characteristics occurred in October 2019, leading to a 7.7% gain in the S&P 500 over the subsequent three months.

Similar consolidations suggest stocks rally in the near term

When the S&P 500 formed a tight consolidation pattern near a five-year high, it showed a strong tendency to rally in the near term, advancing 77% of the time over the subsequent two weeks with returns that displayed significance relative to random outcomes.

The two-month outlook suggests the benchmark index could digest the near-term gains before rallying 82% of the time over the six-month horizon.

Because the study's final condition stipulated that the S&P 500 must close within 0.25% of its high, it should be no surprise that the world's most benchmarked index achieved a new high 100% of the time before the favorable two-week window expired.

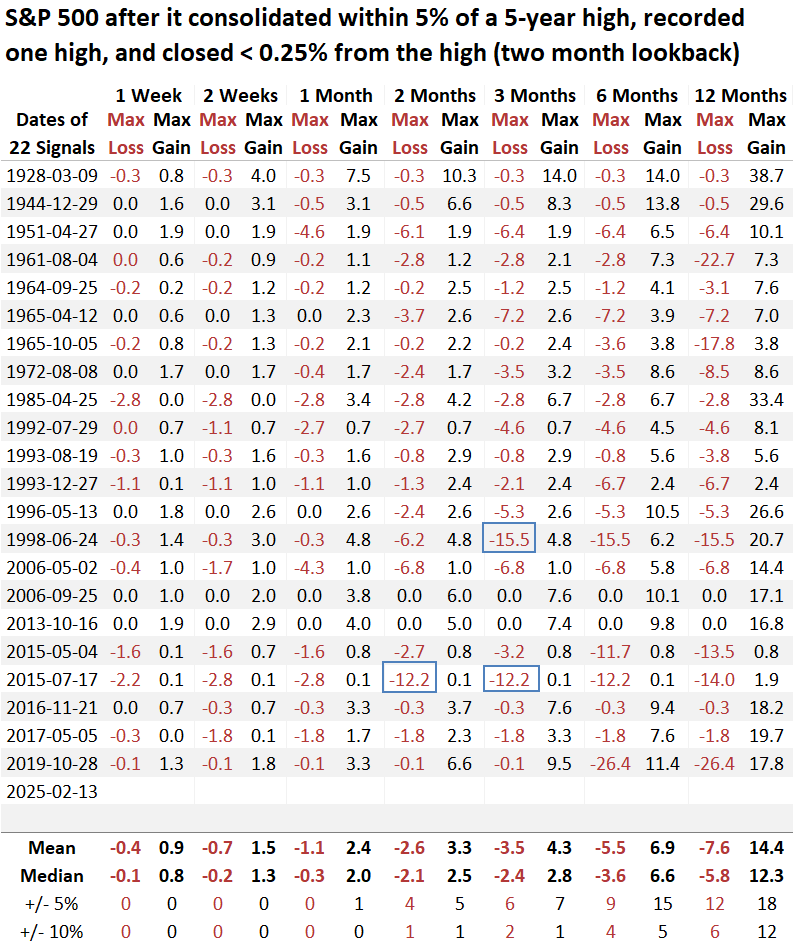
Over the next three months, the S&P 500 experienced only two maximum losses exceeding 10%, implying that a significant downturn is unlikely. 

What the research tells us...

The S&P 500 has demonstrated remarkable resilience over the past few months, consolidating within a narrow range despite a flurry of alarming headlines. This sideways movement amid uncertainty signals buyers maintain control, keeping the market on solid footing. Comparable patterns suggest that such consolidation often precedes an upside breakout, with the index rallying 77% of the time in the following two weeks. This enduring strength highlights underlying market confidence, indicating that even in the face of negative news, investors are willing to hold positions, suggesting the potential for continued upward momentum. 

PRODUCTS
SentimenTrader
Trading Tools
Indicators & Data API
‍
Strategies & Scanner
‍
Research Reports
FREE
RESOUrCES
Simple Backtest
Calculator
Simple Seasonality
Calculator
The Kelly Criterion
Calculator
Sentiment Geo Map
‍
Public Research Reports
‍
Education
Sentiment Indicators
‍
Technical Indicators
‍
Pricing
Bundle pricing
‍
FAQ
‍
Announcements
‍
COMPANY
‍
About
‍
In the News
‍
Testimonials
‍
Client Success Stories
CONTACT
‍
General Inquiries
‍
Media Inquiries
‍
Financial Professionals Inquiries
‍
© 2026 Sundial Capital Research Inc. All rights reserved.
Setsail Marketing
TermsPrivacyAffiliate Program
Risk Disclosure: The information and tools provided are for research and analytical purposes only and are not intended as investment advice. Market analysis involves uncertainty, and outcomes may differ from expectations. Users should conduct their own due diligence and consider their individual circumstances before making any financial decisions. Past performance is not necessarily indicative of future results.

Hypothetical Performance Disclosure: Hypothetical performance results have many inherent limitations, some of which are described below. No representation is being made that any account will or is likely to achieve profits or losses similar to those shown; in fact, there are frequently sharp differences between hypothetical performance results and the actual results subsequently achieved by any particular trading program. One of the limitations of hypothetical performance results is that they are generally prepared with the benefit of hindsight. In addition, hypothetical trading does not involve financial risk, and no hypothetical trading record can completely account for the impact of financial risk of actual trading. for example, the ability to withstand losses or to adhere to a particular trading program in spite of trading losses are material points which can also adversely affect actual trading results. There are numerous other factors related to the markets in general or to the implementation of any specific trading program which cannot be fully accounted for in the preparation of hypothetical performance results and all which can adversely affect trading results.

Testimonial Disclosure: Testimonials appearing on this website may not be representative of other clients or customers and is not a guarantee of future performance or success.